Showing posts with label Financial Astrology. Show all posts

Saturday, July 30, 2022

Trading the S&P 500 with the Lunar Cycle | Randall Ashbourne

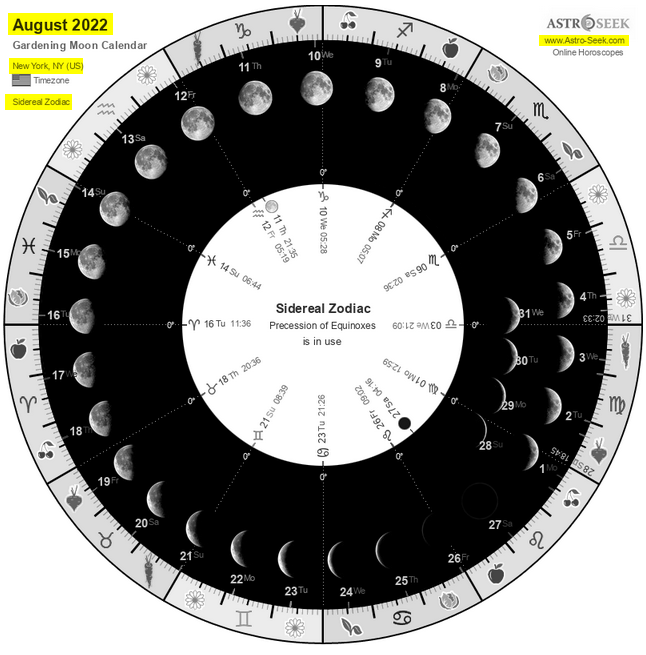
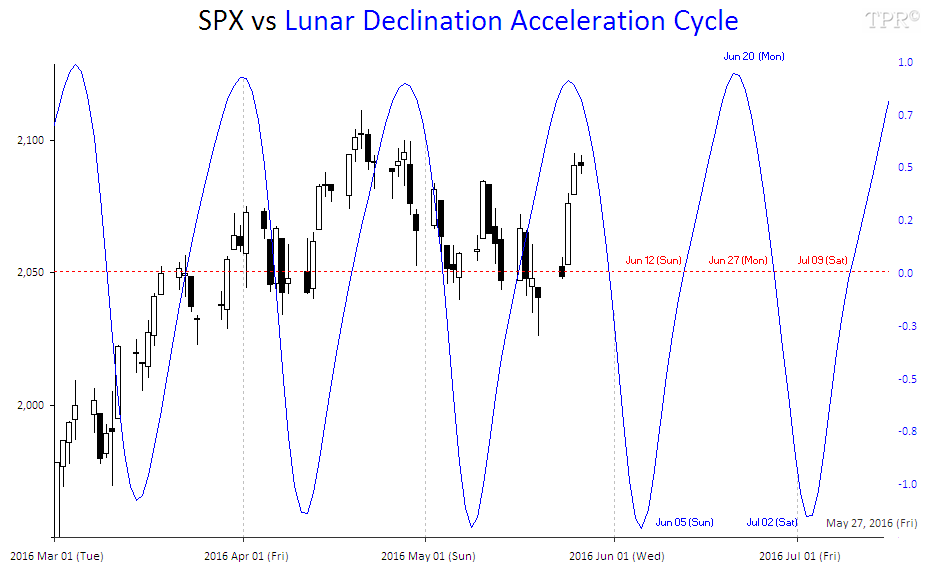
Randall Ashbourne (2011) - [...] stock prices tend to be higher around the time of the New Moon each month and reach a temporary low point around the time of the Full Moon. Now that’s statistically speaking. And there are Lies, Damned Lies - and Statistics! [...] Many of the Lunar trading articles found easily on the internet tend to suggest the potential gains are relatively minor, or that the phenomenon inverts so often that it can’t be used as a reliable trading technique.

[...] What I discovered was that, statistically, the old assertions not only hold up, but when traded consistently over time, produce big profits for small amounts of time exposed to market conditions [...] Buying a single share of the index at the closing price of our starting date on the January 4 New Moon and holding until the close of the June 1 Solar Eclipse New Moon, produced a profit of $44.35 - 3.49% (bottom left corner of the table).
 
 
However, going Long for one share from each Full Moon close to the next New Moon close, produced more than twice the profit - $90.96. So, we were in the market for half the time and twice the profit (the FM-NM green phase label).

[...] Staying OUT of the market during all New Moon-Full Moon phases would have protected us from losing some of our buy-and-hold gains … but delivered much better profits for our Loonytoons strategy by being profitable Short trades. We were in the market ALL the time, but continually reversing positions - to get three times the profit of buy-and-hold. The darker green coloring shows the very profitable trades, the light green shows profitable trades. The rose coloring shows that only ONE “assumed” Short phase would have resulted in a trading loss. But, remember … this is overall, taking into account the full 6 month period.

[...] take advantage of the Quarter Moon dates. So, our trading strategy now becomes to open 1 position at either the New Moon or Full Moon, but to add an extra position at the First Quarter or Third Quarter date. And the table below shows a significant boost to our potential profits: Instead of relying totally on the 14 day Short from NM-FM, we add one extra Short at the 1Q Moon - boosting the overall profit from Short trades from $46.61 to $109.36. And we adopt the same strategy when we reverse to Long trades at the Full Moon - 1 Long at Full Moon and one extra Long at 3Q Moon, boosting our Long profits to $152.56.
 

Taking advantage of the extra Long or Short position at the closing price on the day of the First Quarter or Third Quarter Moon dramatically increases the profits.
 

While the buy-and-hold strategy produced a profit of 3.5%, we could have made marginally more money by Shorting the index for a couple of weeks at each New Moon; twice as much money being exposed to the market for only half of each month from Full Moon to New - and almost six times as much money by playing the odds that the “statistics” will hold true when traded automatically, but consistently, over time.

The Lunar Cycle | Carol S. Mull

Carol S. Mull (198?) - The lunar cycle was first studied and presented to the faculty of the Graduate School of Pace University by Frank J. Guarino, in partial fulfillment of the requirements for the Master of Business Administration degree. Later, his thesis was published by the American Federation of Astrologers. Modern cyclists have carried Guarino's work much farther. Today, it is possible to predict the market with 70% accuracy using only the lunar cycle.
 

The Sun and the Moon are in square aspect (90°) during the first and last quarters, in opposition (180°) at the Full Moon, and in conjunction (0°) at the New Moon. They are in sextile (60°) between the New Moon and the first quarter and between the last quarter and the New Moon. For precise work, compute a heliocentric chart for the times that the Moon, Earth, and Sun are in exact aspect. Unless there are other overshadowing influences, trines (120°) and conjunctions will be up, squares will be down, oppositions will be somewhat up, and sextiles can be either direction.

Most financial astrologers will tell you that oppositions (Full Moons) will sent the market down, but my experience does not verify this. Apparently, the momentum of being between two trines will carry the opposition along. If the next aspect following a sextile is a conjunction, the sextile is likely to correlate with an upward movement. But if the aspect following a sextile is a square, the sextile is likely to be accompanied by a downward-moving market. 

Another lunar cycle concerns the elements. The market tends to move up whenever the Moon is in an Air [Gemini, Libra, Aquarius] or Fire sign [Aries, Leo, Sagittarius] and to move downward whenever the Moon is in an Earth [Taurus, Virgo, Capricorn] or Water sign [Cancer, Scorpio, Pisces]. Other recent experiments have attempted to be the Moon's velocity and the angular rates of positive acceleration or negative acceleration to the market. These have been inconclusive. 

 
References:
Carol S. Mull (1988) - Short-Term Market Forecasting via Astrology. In: Traders World, #4903, Issue #3.
Carol S. Mull (1989) - Mercury and the Dow. In: Traders World, #4915, Issue #15.
 
HERE
HERE

HERE

Tuesday, November 30, 2021

Geocentric and Heliocentric Bradley Indices │ Turning Points 2022


 2021 Dec 10 (Fri) = Low (geo) + High (helio)
2021 Dec 20 (Mon) = Low (helio)
2021 Dec 24 (Fri) = High (geo)
2021 Dec 31 (Fri) = Major High (helio)
2022 Jan 06 (Thu) = Low (helio)
2022 Jan 10 (Mon) = High (helio)
2022 Jan 16 (Sun) = Major Low (geo) +  Low (helio)
2022 Jan 19 (Wed) = High (helio)
2022 Jan 30 (Sun) = Major Low (helio)
2022 Feb 07 (Mon) = High (helio)
2022 Feb 11 (Fri) = Low (helio)
2022 Feb 12 (Sat) = High (geo)

2022 Feb 20 (Sun) = High (helio)
2022 Feb 26 (Sat) = Low (geo)
2022 Mar 04 (Fri) = Low (helio)
2022 Mar 06 (Sun) = High (geo)

2022 Mar 10 (Thu) = Low (geo)+ High (helio)
2022 Mar 18 (Fri) = Low (helio)
2022 Mar 20 (Sun) = Major High (geo)

2022 Mar 28 (Mon) = Major High (helio)
2022 Mar 29 (Tue) = Major Low (geo)

2022 Apr 04 (Mon) = Low (helio)
2022 Apr 08 (Fri) = High (helio)
2022 Apr 13 (Wed) = Low (helio)
2022 Apr 17 (Sun) = High (helio)
2022 Apr 20 (Wed) = Low (helio)
2022 Apr 27 (Wed) = High (helio)
2022 Apr 28 (Thu) = High (geo)

2022 May 10 (Tue) = Low (geo)
2022 May 14 (Sat) = Major Low (helio)
2022 May 20 (Fri) = Major High (geo) +  High (helio)
2022 May 28 (Sat) = Low (helio)

2022 Jun 02 (Thu) = Low (geo)
2022 Jun 07 (Tue) = High (helio)
2022 Jun 16 (Thu) = High (geo) + Low (helio)
2022 Jun 24 (Fri) = High (helio)
2022 Jun 28 (Tue) = Low (helio)
2022 Jul 05 (Tue) = High (helio)
2022 Jul 06 (Wed) = Low (geo)

2022 Jul 10 (Sun) = Low (helio)
2022 Jul 13 (Wed) = High (geo)
2022 Jul 15 (Fri) = Major High (helio)
2022 Jul 27 (Wed) = Major Low (geo)
2022 Jul 28 (Thu) = Low (helio)

2022 Aug 01 (Mon) = High (helio)
2022 Aug 04 (Thu) = High (geo)
2022 Aug 09 (Tue) = Low (geo)
2022 Aug 11 (Thu) = Major Low (helio)
2022 Aug 18 (Thu) = Major High (geo)
2022 Aug 22 (Mon) = High (helio)
2022 Aug 27 (Sat) = Low (helio)
2022 Aug 28 (Sun) = Low (geo)

2022 Sep 01 (Thu) = High (helio)
2022 Sep 11 (Sun) = Low (helio)
2022 Sep 12 (Mon) = High (geo)

2022 Sep 18 (Sun) = Low (geo)
2022 Sep 21 (Wed) = Major High (helio)
2022 Sep 22 (Thu) = High (geo)
2022 Sep 28 (Wed) = Low (helio)
2022 Oct 01 (Sat) = Low (geo)
2022 Oct 03 (Mon) = High (helio)

2022 Oct 08 (Sat) = Major Low (helio)
2022 Oct 12 (Wed) = High (geo)
2022 Oct 13 (Thu) = High (helio)
2022 Oct 16 (Sun) = Low (helio)
2022 Oct 17 (Mon) = Low (geo)

2022 Oct 18 (Tue) = High (geo)
2022 Oct 22 (Sat) = High (helio)
2022 Oct 27 (Thu) = Low (helio)
2022 Oct 30 (Sun) = High (helio)
2022 Nov 04 (Fri) = Major Low (geo)
2022 Nov 05 (Sat) = Low (helio)

2022 Nov 15 (Tue) = Major High (geo)
2022 Nov 16 (Wed) = Major High (helio)
2022 Nov 26 (Sat) = Low (helio)
2022 Nov 29 (Tue) = High (helio)
2022 Dec 03 (Sat) = Low (helio)
2022 Dec 04 (Sun) = Major Low (geo)

2022 Dec 07 (Wed) = High (helio)
2022 Dec 10 (Sat) = Low (helio)
2022 Dec 19 (Mon) = High (helio)
2022 Dec 30 (Fri) = Major Low (helio)
2023 Jan 05 (Thu) = Major High (geo)
2023 Jan 17 (Tue) = Major Low (geo)


[calculated for New York City: EST / EDT │ Geo-Helio-Clusters]

Some background on the Bradley Indices
and previous turning points HERE

Wednesday, December 2, 2020

Geocentric and Heliocentric Bradley Indices │ Turning Points 2021

 
2020 Nov 30 (Mon) = Low (helio)
2020 Dec 06 (Sun) = High (helio)
2020 Dec 17 (Thu) = Low (helio)
2021 Jan 01 (Fri) = High (helio)
2021 Jan 09 (Sat) = Low (geo + helio)
2021 Jan 13 (Wed) = High (helio)
2021 Jan 20 (Wed) = Low (helio)
2021 Jan 26 (Tue) = High (helio)
2021 Jan 28 (Thu) = Low (helio)
2021 Feb 01 (Mon) = High (helio)
2021 Feb 04 (Thu) = Low (helio)
2021 Feb 08 (Mon) = High (helio)
2021 Feb 14 (Sun) = Low (helio)
2021 Feb 19 (Fri) = High (helio)
2021 Feb 27 (Sat) = Low (helio)
2021 Mar 04 (Thu) = High (helio)
2021 Mar 15-16 (Mon-Tue) = Low (helio + geo)
2021 Mar 20-21 (Sat-Sun) = Low + High (geo + helio)
2021 Mar 28 (Sun) = Low (helio)
2021 Apr 01 (Thu) = High (geo + helio)
2021 Apr 07 (Wed) = Low (helio)
2021 Apr 09 (Fri) = Low (geo)
2021 Apr 11 (Sun) = High (helio)
2021 Apr 18 (Sun) = High (geo + helio)
2021 Apr 23 (Fri) = High (helio)
2021 Apr 25 (Sun) = Low (geo)
2021 Apr 27 (Tue) = Low (helio)
2021 Apr 29-30 (Thu-Fri) = High (geo + helio)
2021 May 04 (Tue) = Low (geo + helio)
2021 May 14 (Fri) = High (geo)
2021 May 18 (Tue) = High (helio)
2021 May 26-27 (Wed-Thu) = Low (geo + helio)
2021 Jun 02-04 (Wed-Fri) = High (helio + geo)
2021 Jun 14 (Mon) = Low (helio)
2021 Jun 19 (Sat) = High (helio)
2021 Jun 24 (Thu) = Low (helio)
2021 Jul 06 (Tue) = Low-High (geo + helio)
2021 Jul 14-15 (Wed-Thu) = Low-High (helio + geo)
2021 Jul 18 (Sun) = High (helio)
2021 Jul 25-27 (Sun-Tue) = Low-High (helio + geo)
2021 Jul 31 - Aug 02 (Sat-Mon) = Low (helio + geo)
2021 Aug 07 (Sat) = High (geo)
2021 Aug 11 (Wed) = Low (geo)
2021 Aug 14 (Sat) = High (helio)
2021 Aug 20-22 (Fri-Sun) = High-Low (geo + helio)
2021 Aug 25 (Wed-Fri) = Low-High (geo + helio)
2021 Aug 31 (Tue) = High (geo)
2021 Sep 04 (Sat) = Low (helio)
2021 Sep 16-18 (Thu-Sat) = High-Low (helio + geo)
2021 Sep 29 (Wed) = High (geo)
2021 Oct 01-03 (Fri-Sun) = Low-High (helio)
2021 Oct 09 (Sat) = Low (geo)
2021 Oct 12 (Tue) = High (geo)
2021 Oct 13-14 (Wed-Thu) = Low-High (helio)
2021 Oct 16 (Sat) = Low (helio)
2021 Oct 22 (Fri) = High (helio)
2021 Oct 27 (Wed) = Low (helio)
2021 Oct 30 (Sat) = High (helio)
2021 Nov 06-07 (Sat-Sun) = Low (helio + geo)
2021 Nov 10 (Wed) = High (helio)
2021 Nov 19 (Fri) = Low (helio)
2021 Nov 23 (Tue) = High (helio)
2021 Nov 27-28 (Sat-Sun) = Low-High (helio + geo)
2021 Dec 10 (Fri) = Low-High (geo + helio)
2021 Dec 20 (Mon) = Low (helio)
2021 Dec 24 (Fri) = High (geo)
2021 Dec 31 (Fri) = High (helio)
2022 Jan 06 (Thu) = Low (helio)
2022 Jan 10 (Mon) = High (helio)
2022 Jan 16 (Sun) = Low (geo + helio)
2022 Jan 19 (Wed) = High (helio)
2022 Jan 30 (Sun) = Low (helio)

[calculated for New York City]

Some background on the Bradley Indices
and previous turning points HERE

S&P 500 Index vs Jupiter – Saturn Cycle | December 2020

SoLunar Map | December 2020 - January 2021

Recent and upcoming SoLunar Turn-Days: Nov 30 (Mon), Dec 03 (Thu), Dec 07 (Mon), Dec 11 (Fri),
Dec 15 (Tue), Dec 18 (Fri), Dec 22 (Tue), Dec 26 (Sat), Dec 30 (Wed), Jan 02 (Sat), Jan 06 (Wed),
Jan 09 (Sat), Jan 13 (Wed), Jan 17 (Sun), Jan 21 (Thu), Jan 24 (Sun), Jan 28 (Thu), Feb 01 (Mon),
Feb 04 (Thu). Previous SoLunar Maps HERE

Cosmic Cluster Days | December 2020 - January 2021

Recent and upcoming Cosmic Cluster Days: Nov 16 (Mon), Nov 18 (Wed), Dec 05 (Sat), Dec 31 (Thu),
Jan 14 (Thu), Jan 22 (Fri), Feb 01 (Mon), Feb 08 (Mon). Previous CCDs are HERE

Saturday, October 31, 2020

SoLunar Map | Review and Preview for November 2020

SoLunar Map | Review and Preview for November 2020
Upcoming solunar turn-days: Oct 31 (Sat) = Full Moon, Nov 01 (Sun), Nov 04 (Wed),
Nov 08 (Sun), Nov 11 (Wed), Nov 15 (Sun), Nov 19 (Thu), Nov 22 (Sun), Nov 26 (Thu),
Nov 30 (Mon) = Full Moon, Dec 03 (Thu), Dec 07 (Mon). Previous SoLunar Maps HERE

S&P 500 Index vs Jupiter – Saturn Cycle | November 2020

Upcoming turn-days: Nov 02 (Mon), Nov 07 (Sat), Nov 11 (Wed), Nov 15 (Sun),
Nov 19 (Thu), Nov 24 (Tue), Nov 28 (Sat), Dec 04 (Fri), Dec 07 (Mon), Dec 11 (Fri).
Previous turn-days HERE

Sunday, September 27, 2020

Cosmic Cluster Days | October - November 2020

Upcoming Cosmic Cluster Days: Oct 01-02 (Thu-Fri), Oct 12 (Mon), Oct 16 (Fri), Oct 21 (Wed),
Oct 23 (Fri), Oct 26 (Mon), Oct 28 (Wed), Oct 30 (Fri), Nov 03 (Tue), Nov 12 (Thu),
Nov 15-16 (Sun-Mon), Nov 18 (Wed).
Previous CCDs HERE

SoLunar Map | October - November 2020

Upcoming SoLunar Turn-Days:
Sep 24 (Thu), Sep 28 (Mon), Oct 01 (Thu), Oct 05 (Mon), Oct 09 (Fri), Oct 13 (Tue),
Oct 17 (Sat), Oct 20 (Tue), Oct 24 (Sat), Oct 28 (Wed), Nov 01 (Sun), Nov 04 (Wed),
Nov 08 (Sun), Nov 11 (Wed), Nov 15 (Sun), Nov 19 (Thu), Nov 22 (Sun), Nov 26 (Thu),
Nov 30 (Mon), Dec 03 (Thu). Previous SoLunar Maps HERE