Analyze the news calendar to identify when and where high-probability setups are likely to occur. I
can't overstate how crucial it is to use the calendar effectively.
Developing an understanding of how the week will unfold based on
scheduled events doesn’t come overnight—it takes consistent practice and
repetition.
The goal is to anticipate market structure before it forms. Once you develop the ability to do this with accuracy, trading becomes significantly easier. And if the market doesn’t align with your expectations? That either means the setup is invalid, or it’s time to adapt your trading plan.
Preparation is 90% of the work. Some may resist this idea, but it’s the reality. If you’re sitting down at the charts each day or week without knowing when you should be engaging with the market, then you're essentially trading blind. Start every week with clarity: know exactly which days and what times you plan to be active. Without this structure, you’ll likely end up glued to your screen, trading aimlessly and without purpose.
The following ICT Weekly Range Profiles are conceptual models that describe typical patterns of how prices might behave during a trading week. Each profile has unique
characteristics that can guide traders in anticipating potential market
movements. However, it’s important to note that these profiles are not
rigid predictions but rather frameworks to understand market
tendencies.
(1 — A) Classic Tuesday Low of the Week = Bullish Profile
How to anticipate? To anticipate all this phenomenon you should know the HTF PDA. When the market fails to drop into the discount array on Monday then its most likely that Tuesday will se the drive lower to mark weekly low in London or New York session.
(1 — B) Classic Tuesday High of the Week = Bearish Profile
When price is bearish it may manipulate on Monday and hover below a higher time frame premium, array. Then on Tuesday it rises into higher time frame premium array to form high of the week.
How to anticipate? To anticipate all this phenomenon you should know the higher time frame Premium array. When the market fails to rise into the premium array on Monday then its most likely that Tuesday will se the drive higher to mark weekly high in London or New York session.
(2 — A) Wednesday Low of the Week = Bullish Profile
When price is bullish it may manipulate on Monday and Tuesday and hover above a higher a higher time frame discount array. Then on Wednesday it drops into higher time frame discount array to form low of the week.
How to anticipate? To anticipate all this phenomenon one should know the higher time frame Discount Array. When the market fails to drop into the discount array on Monday and Tuesday then its most likely that Wednesday will se the drive lower to mark weekly low in London or New York session.
( 2 — B) Wednesday High of the Week = Bearish Profile
When price is bearish it may manipulate on Monday and Tuesday and hover below a higher a higher time frame premium array. Then on Wednesday it rises into higher time frame premium array to form high of the week.
How to anticipate? To anticipate all this phenomenon you should know the higher time frame premium array. When the market fails to rise into the premium array on Monday and Tuesday then its most likely that Wednesday will se the drive higher to mark weekly high in London or New York session.
(3 — A) Consolidation Thursday Bullish Reversal
When price is bullish it may consolidate on Monday through Wednesday then runs the intra-week low and rejects it forming a market reversal.
How to anticipate? To anticipate this you must know the higher timeframe discount array. And when price fails to drop into higher timeframe discount array then its likely that Thursday will see drive lower on market driver news or interest rate release late New York session around 02:00 PM (New York local time).
(3 — B) Consolidation Thursday Bearish Reversal
When price is bearish it may consolidate on Monday through Wednesday then runs the intra-week high and rejects it forming a market reversal.
How to anticipate? To anticipate this you must know the higher timeframe premium array. And when price fails to rise into higher timeframe premium array then its likely that Thursday will see drive higher on market driver news or interest rate release late New York session around 02:00 PM (New York local time).
(4 — A) Consolidation Midweek Rally = Bullish Profile
When price is bullish and consolidates Monday through Wednesday then runs into intra-week high and expands higher into Friday.
How to anticipate? When the price is bullish and has yet to run to premium array on the higher timeframe and it has recently rallied from a discount array and simply paused without any bearish reversal price action. This indicates price is about to expand higher for the premium array.
(4 — B) Consolidation Midweek Decline = Bearish Profile
When price is bearish and consolidates Monday through Wednesday then runs into intra-week low and expands lower into Friday.
How to anticipate? When the price is bearish and has yet to run to discount array on the higher timeframe and it has recently declined from a premium array and simply paused without any bullish reversal price action. This indicates price is about to expand lower for the premium array.
(5 — A) Seek and Destroy Bullish Friday = Neutral-Low Probability Profile
When price consolidates Monday through Thursday running shallow stops under and above intra-week high, then runs the intra-week high and expands higher into Friday.
How to anticipate? When market is awaiting interest rate announcements or Non-Farm Payroll, it can create this profile in the summer months of July and August. Better to avoid trading in these conditions.
(5 — B) Seek and Destroy Bearish Friday = Neutral-Low Probability Profile
When price consolidates Monday through Thursday running shallow stops under and above intra-week high, then runs the intra-week low and expands lower into Friday.
How to anticipate? When market is awaiting interest rate announcements or Non-Farm Payroll, it can create this profile in the summer months of July and August. Better to avoid trading in these conditions.
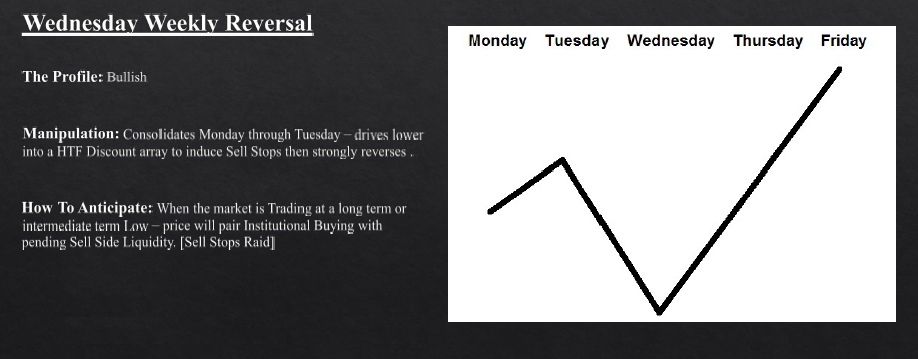
(6 — A) Wednesday Weekly Bullish Reversal = Bullish Profile
When price is bullish and consolidates Monday through Tuesday and drives lower into higher timeframe discount array on Wednesday to induce sell stops and then strongly reverses.
How to anticipate? When the market is trading at the long term or intermediate term low, price will pair institutional buying with pending sell side liquidity (sell stops raid).
(6 — B) Wednesday Weekly Bearish Reversal = Bearish Profile
When price is bearish and consolidates Monday through Tuesday and drives higher into higher timeframe premium array on Wednesday to induce buy stops and then strongly reverses.
How to anticipate? When the market is trading at the long term or intermediate term high, price will pair institutional selling with pending buy side liquidity (buy stops raid).
Understanding the ICT Weekly Profiles is only the starting point. To make them genuinely useful, you must integrate them into a broader, disciplined trading framework. The key is context, confirmation, and risk control. Use the profiles as a structural guide—not a standalone signal—and anchor them in higher-timeframe direction and real-world catalysts.
1. Anchor to the Higher-Timeframe Trend: ICT Weekly Profiles work best when traded in harmony with the dominant trend. Always establish the market’s higher-timeframe bias—daily, weekly, or monthly—and only execute profiles that align with that bias. For example, in a bullish environment, prioritize setups like the Classic Tuesday Low of the Week or Wednesday Monthly Bullish Reversal.
2. Pair Profiles with Confirmation: Weekly Profiles should be validated with secondary evidence. Confirmation may come from indicators, candlestick structure, liquidity arrays, or macro data. If anticipating a Classic Tuesday Low, look for confluence such as a bullish rejection wick, a displacement shift, or supportive economic releases. Layering signals increases conviction and filters out low-quality trades.
3. Prioritize Risk Management: Profiles suggest timing, not certainty. Protect your capital with disciplined stop-loss placement, logical invalidation points, and appropriate position sizing. For instance, on a Wednesday Weekly Bullish Reversal, a stop beneath the higher-timeframe discount array preserves structure and defines risk. Consistent risk control is what keeps you solvent long enough for edge to play out.


%20-%20Trade%20Management%20%5B11%20p.%5D-04.png)
%20-%20Trade%20Management%20%5B11%20p.%5D-05.png)