Thursday, April 27, 2023

The 3 Day Cycle | Cameron Benson

 
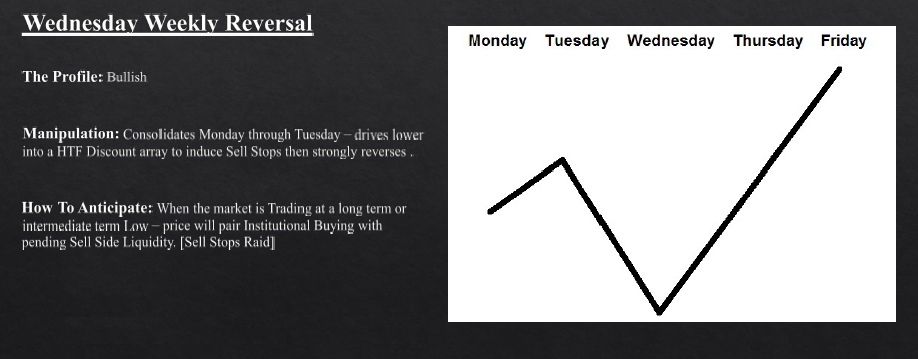
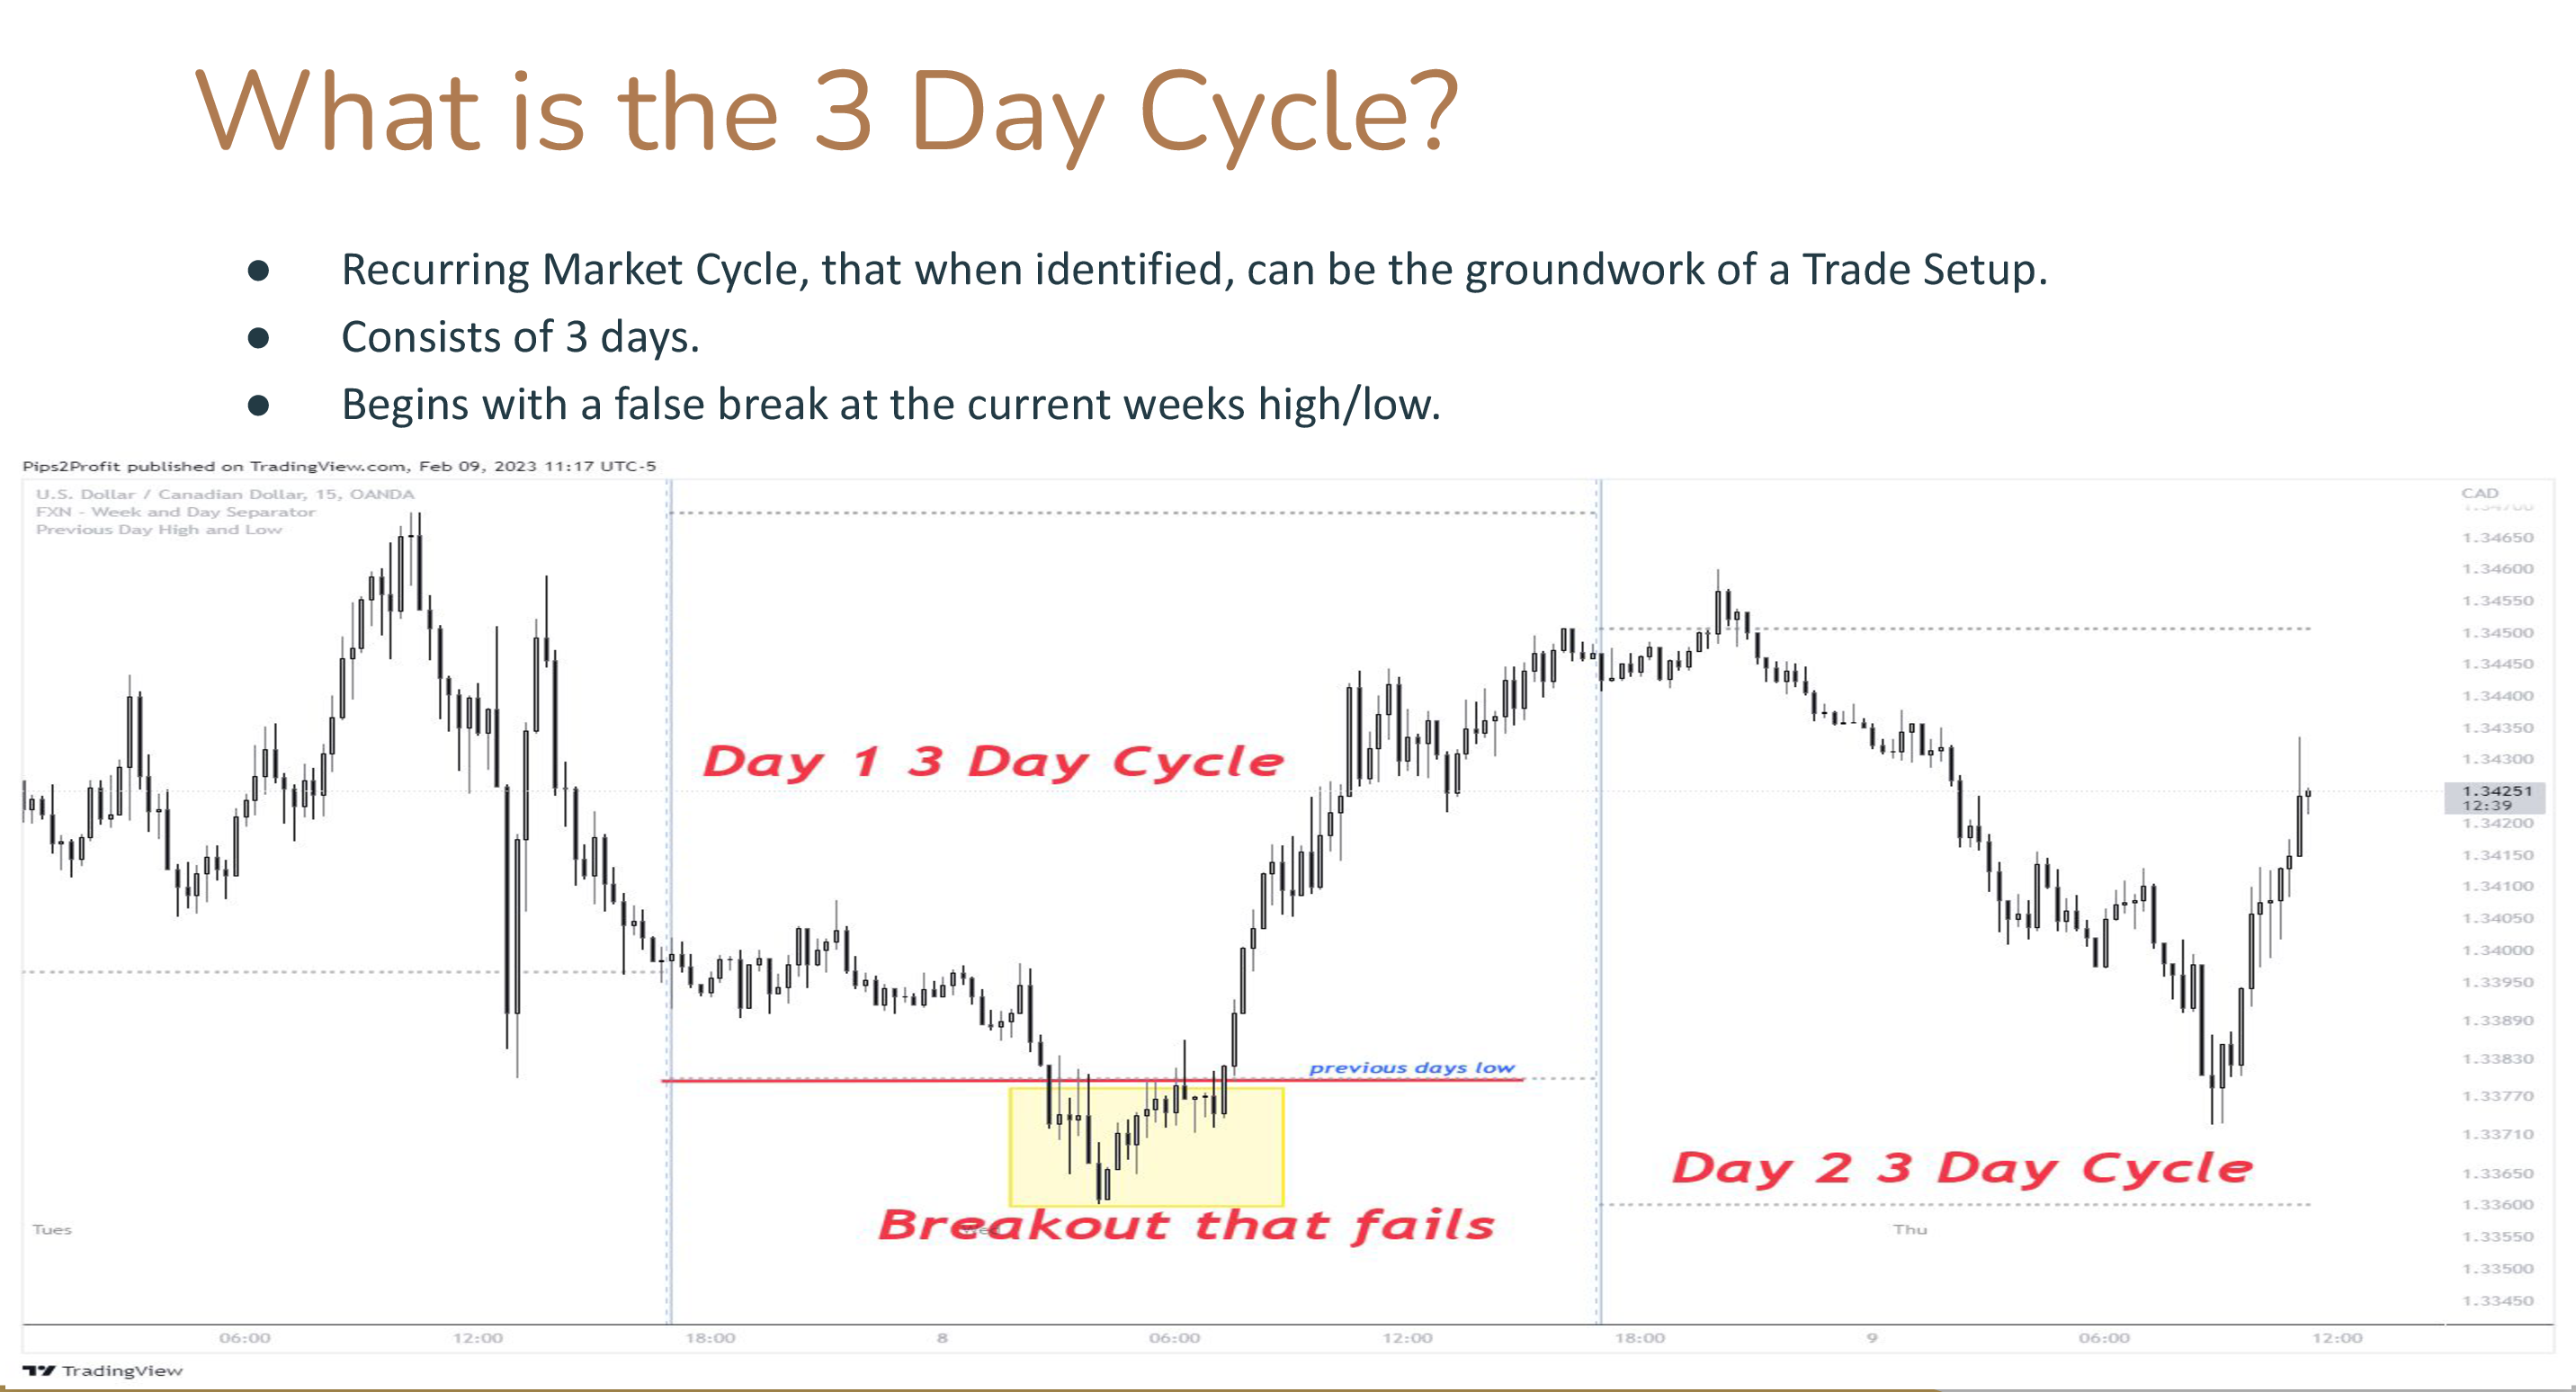
The 3 Day Cycle  is a recurring market cycle, that when identified, can be the groundwork of a trade setup. It consists of 3 days, and begins with a false break at the current weeks high or low. In his Best Trade Setups Playbook Stacey Burke described the 3 Day Cycle setups as either pump and dumps, or dump and pumps: "They [the market makers] pump, pump, pump, go sideways and drop a bit, one more small pump, then a dump. The dump can go straight down, fast. The pump up, may often be hard to trade on the first day, the price action can be choppy, and back and forth, a slow grinding auction. Other times, you are forced to "chase the move."  

 
Finding Day 1:
Look for a false break above or below a previous day's high or low AT THE HIGH OR LOW OF THE WEEK.

Attributes of Day 1:
1. Breaks Below/Above Previous Days High or Low at the high of the week, and the day closes back inside of previous days range.
a. Sub Variation: Breaks through previous days level and days closes above/below that level. 
The following day, price comes back inside of the the range from 2 days ago and closes.
2. Can become a First Green Day or First Red Day (Signal for following day).
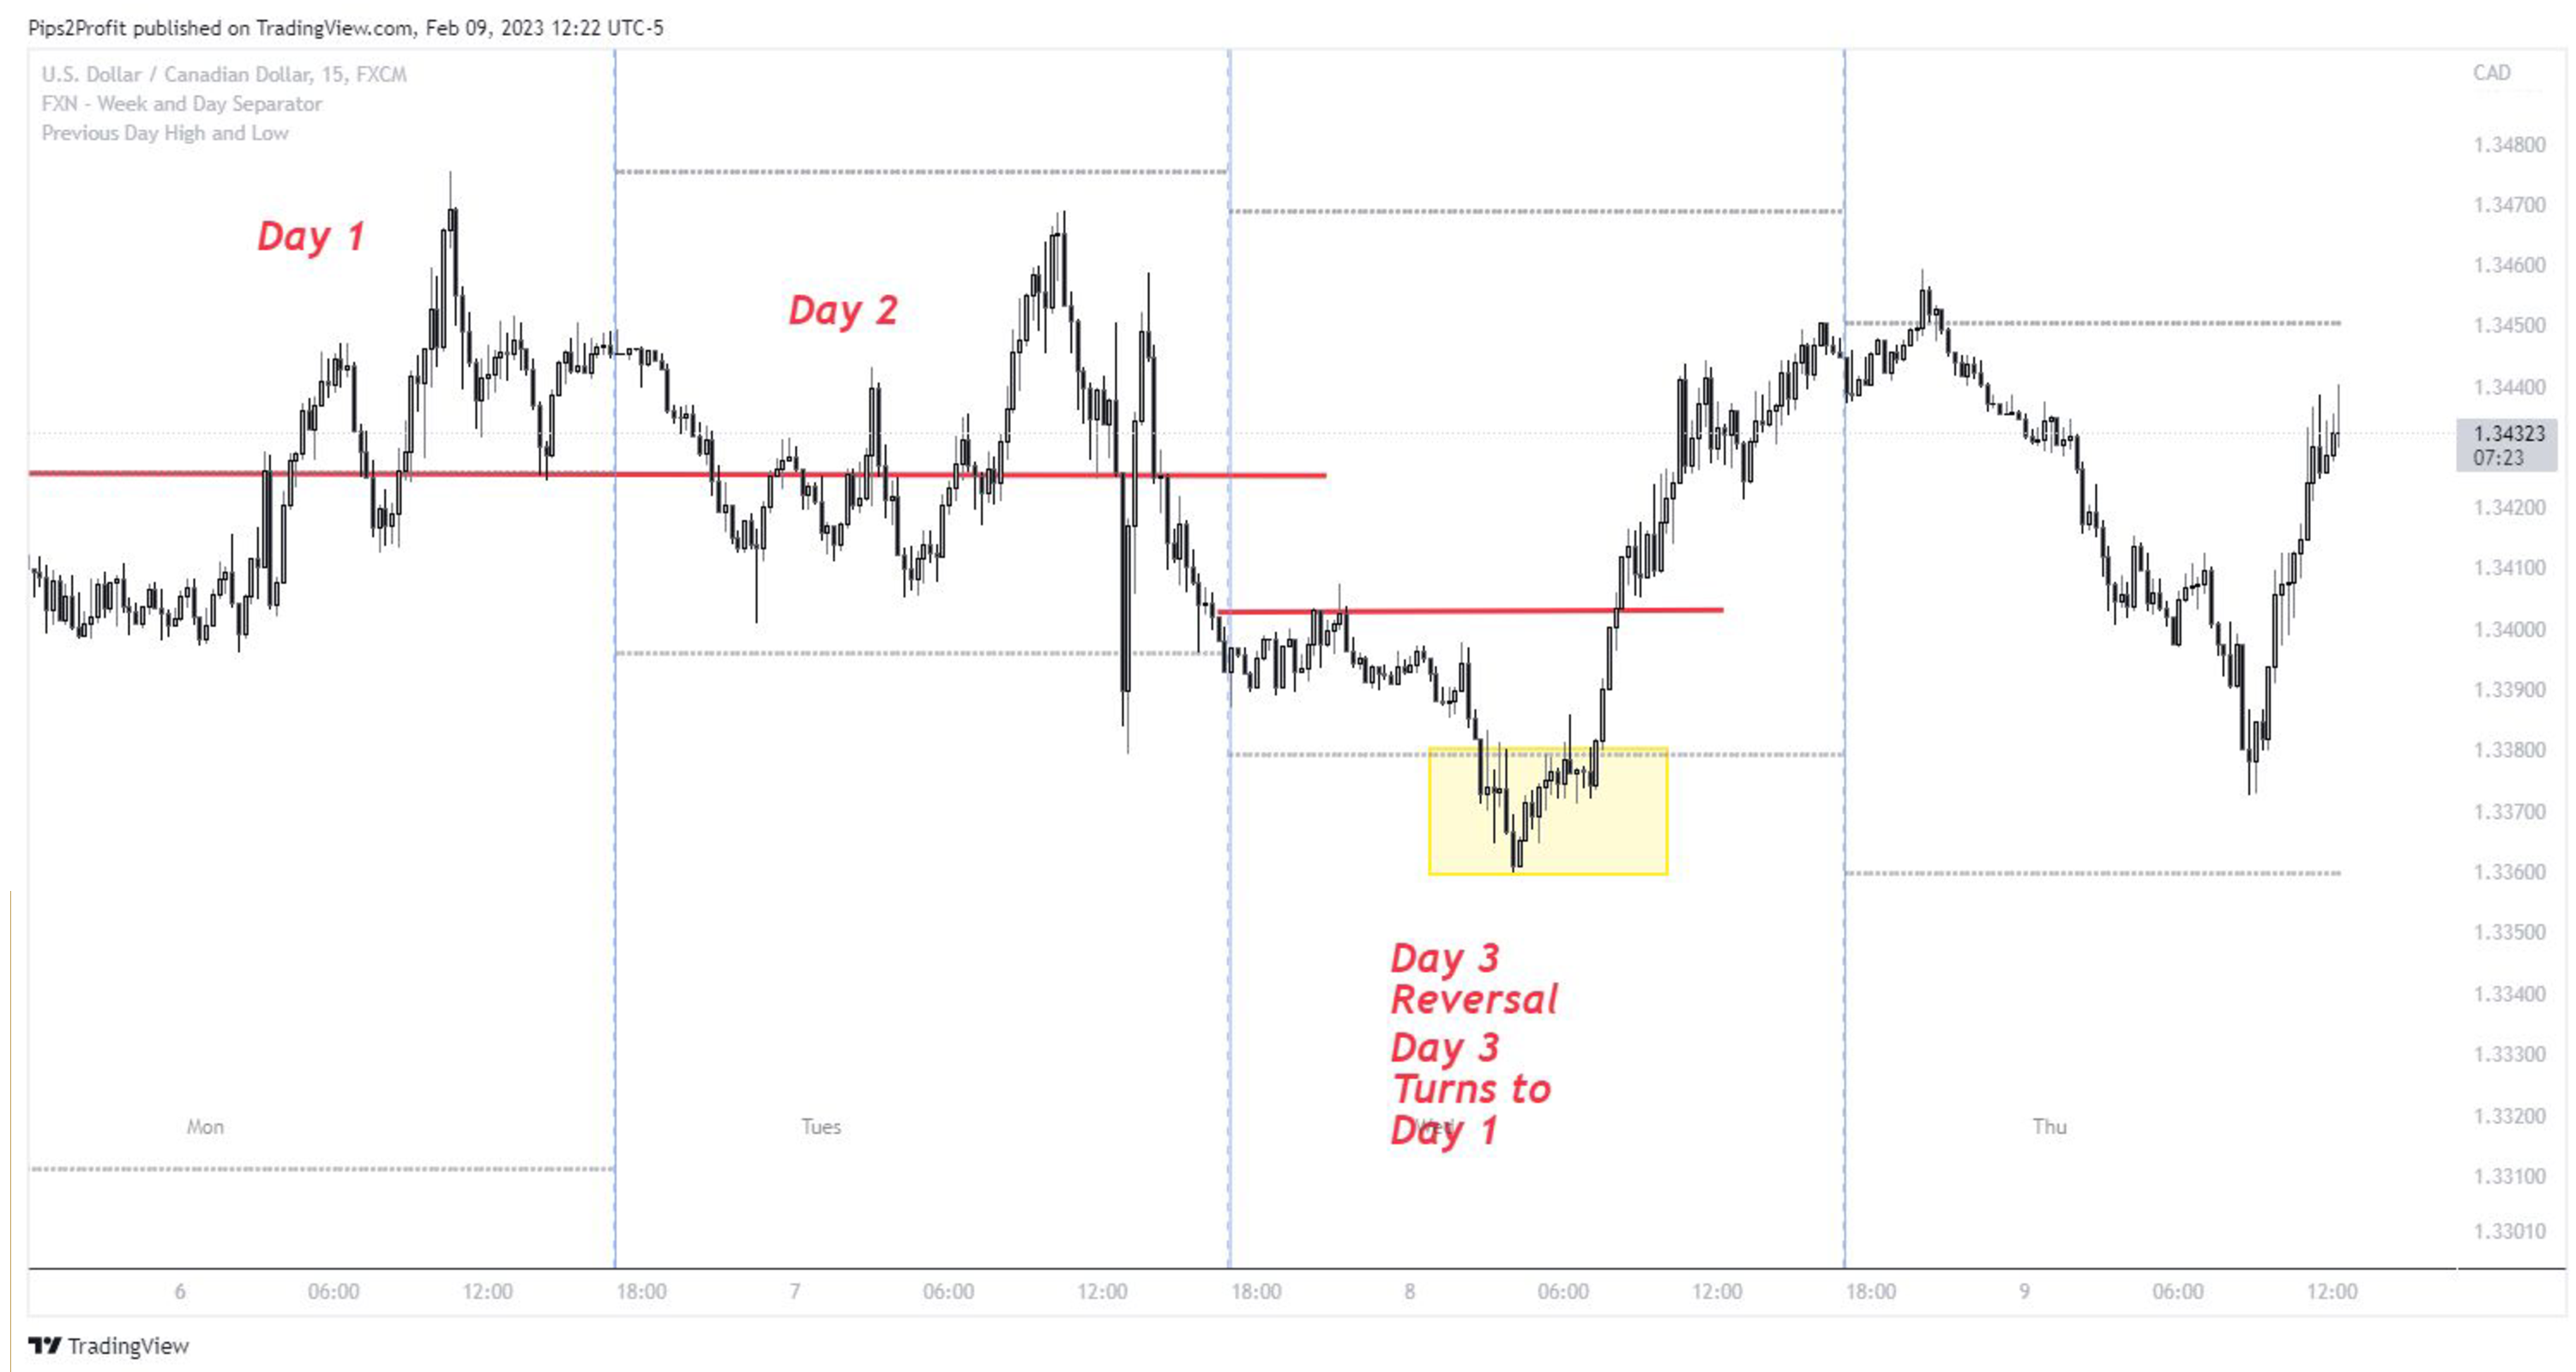
3. Day 3 sometimes turns into Day 1 at the close of the day.


 Attributes of Day 2 of the 3 Day Cycle:

Day 2 can be either
1. Continuation in direction of false break; or:
2. It can turn into ...
    a.) a First Red Day (FGD)
    b.) a First Green Day (FRD)
    c.) an Inside Day
    d.) a Trend Day

Areas of Interest:
1. High of the Day/Low of the Day (HOD/LOD)
2. High of the Session/Low of the Session (HOS/LOS)
3. Outside Day/Inside Day (Was there a false break?) (Act as Support/Resistance)
4. Low Bear/High Bull (Support/Resistance)

Day 2 Trade Setups:
- Long/Short Squeeze
- Parabolic Trend Trade
- High of the Session/Low of the Session (HOD/LOD) Trade
- High of the Day/Low of the Day (HOD/LOD)
- Low Hanging Fruit (LHF) Continuation (Trend Trade)

Method:
1. Support/Resistance References:
a. Low Bear/High Bull
b. Previous Days High/Low
c. HOD/LOD
2. Measure 3 Levels of rise/fall from Low/High of day for potential strike zone.
3. Use Support/Resistance References as additional confluence.
 
 
Attributes of Day 3 of the 3 Day Cycle:

1. Day 3 is the last day of the 3 Day Cycle.
2. A lot of times Day 3 can turn into Day 1, either on the current day or the next day 
(Reset of the Day Count).
3. Day 3 can either become a blow off trend continuation day (in the direction of the trend) or a reversal day.

Trade Setups:
1. Parabolic/Capitulation Trend
2. Reversal HOW/LOW
3. LHF Continuation (Trend Trade)

Areas of Interest:
1. Low/High of week
2. Previous Days High/Low (Support/Resistance/Trapped Volume)
3. High/Low of Day
4. High Bull/Low Bear (Support/Resistance)
5. OD/ID (Outside Day/Inside Day)

Reference:
 
See also:

The 3 Week Cycle | Cameron Benson

 
There are multiple ways of Week 1 taking place: 

1.) Price breaks out and fails at the High/Low of the month above or below a previous weeks high/low.
2.) A 3 Week Cycle has completed (gone through week 1,2,3), but has not reversed on week 3. 
I refer to this as a "revolving door" style a.k.a. Trending Model of the 3 week cycle.
3.) A breakout occurs above/below previous weeks level, and on the following week reverses back above/below that level.
4.) On week 3 the market reverses BUT on the following week the market continues in the previous direction (a.k.a. Reset). 


See also:

Wednesday, April 5, 2023

Unity and Source | Seyyed Hossein Nasr

Omnia in uno sunt, et in omnibus unum.
All things are in one, and in all one.
Athanasius Kircher (1663)
 
» Ultimate Reality is at once Absolute and Infinite, the source of all being, of all consciousness and of all life. Itself beyond form, it speaks to mankind through revealed forms which, while externally bound and limited, open up inwardly towards the Boundless. Through revelations of this Word or Logos come into being the sacred traditions which although outwardly different are inwardly united into a Center which transcends all forms. They are, however, the bridge from the periphery to the Center, from the relative to the Absolute, from the finite to the Infinite, from multiplicity to Unity. «

Seyyed Hossein Nasr

Quoted from:
Seyyed Hossein Nasr (1976) - Ultimate Reality. 
Foreword to Keith Critchlow - Islamic Patterns. An Analytical and Cosmological Approach.

Only the Right Side | Jesse Livermore


» It takes a man a long time to learn all the lessons of his mistakes. 
They say there are two sides to everything.
But there is only one side to the stock market; and it is not the bull side or bear side but the right side.
It took me longer to get that principle fixed firmly in my mind 
than it did most of the more technical phases of the game of stock speculation.
 
 I have heard of people who amuse themselves conducting imaginary operations in the
stock market to prove with imaginary dollars how right they are. 
Sometimes these ghost gamblers make millions. 
It is very easy to be a plunger that way.
 
It is like the old story of the man who was going to fight a duel the next day.
His second asked him, "Are you a good shot?"
"Well," said the duelist, "I can snap the stem of a wineglass at twenty paces," and he looked modest.
"That's all very well," said the unimpressed second. 
"But can you snap the stem of the wineglass while the wineglass is pointing a loaded pistol straight at your heart?" «

Jesse Livermore

Quoted from:
Edwin Lefèvre (1923) - Reminiscences of a Stock Operator.

ICT Weekly Range Profiles | Michael J. Huddleston


These profiles are conceptual models that describe typical patterns in how prices might behave during a trading week. Each profile has unique characteristics that can guide traders in anticipating potential market movements. However, it’s important to note that these profiles are not rigid predictions but rather frameworks to understand market tendencies. 
 
The weekly price movement in financial markets follows a recurring pattern of consolidation, expansion, reversal, expansion again, consolidation, and a potential reverse or retracement:
  1. Sunday Open Consolidation: The week often begins with price consolidation on the Sunday open, reflecting a cautious approach as traders assess the weekend developments.
  2. Monday Expansion: As the trading week gains momentum, Monday is typically marked by an expansion phase. This reflects increased activity and movement as traders react to new information.
  3. Tuesday Reversal: The following day, Tuesday, often witnesses a reversal in price trends. This can be attributed to traders reassessing their positions after the initial expansion phase.
  4. Wednesday Expansion: Midweek, the market tends to experience another expansion phase. This reflects a renewed bout of activity and movement in response to evolving market dynamics.
  5. Thursday Consolidation: On Thursday, there’s often a consolidation phase. Price ranges may narrow as traders assess the overall sentiment and prepare for the end of the trading week.
  6. Midweek Friday Reverse or Retrace: As the week approaches its close, Friday may see a reversal or retracement in trends. Traders might adjust their positions before the weekend, leading to a shift in price direction.

This weekly cycle reflects the rhythm of market sentiment and participant actions throughout the trading week.


Sunday, March 19, 2023

Backtesting ICT 2022 Mentorship Trading Setups | Hannah Forex

A Trading Setup is an indication of a higher probability of one thing happening over another.  

Reference:
Hannah Forex (Mar 9, 2023) - I take these trades over and over again ... | ICT mentorship model.
 

Anything Can Happen | Mark Douglas

The semiretired chairman of the board of the brokerage firm was a longtime trader with nearly 40 years of experience in the grain pits at the Chicago Board of Trade. He didn't know much about technical analysis, because he never needed it to make money on the floor. But he no longer traded on the floor and found the transition to trading from a screen difficult and somewhat mysterious. So he asked the firm's newly acquired star technical analyst to sit with him during the trading day and teach him technical trading. The new hire jumped at the opportunity to show off his abilities to such an experienced and successful trader. The analyst was using a method called "point and line",  developed by Charlie Drummond (HERE).
 

One day, as the two of them were watching the soybean market together, the analyst had projected major support and resistance points and the market happened to be trading between these two points.  As the technical analyst was explaining to the chairman the significance of these two points, he stated in very emphatic, almost absolute terms that if the market goes up to resistance, it will stop and reverse; and if the market goes down to support, it will also stop and reverse. Then he explained that if the market went down to the price level he calculated as support, his calculations indicated that would also be the low of the day. 
 
As they sat there, the bean market was slowly trending down to the price the analyst said would be the support, or low, of the day. When it finally got there, the chairman looked over to the analyst and said, "This is where the market is supposed to stop and go higher, right?" The analyst responded, "Absolutely! This is the low of the day." "That's bullshit!" the chairman retorted. "Watch this." He picked up the phone, called one of the clerks handling orders for the soybean pit, and said, "Sell two million beans bushels at the market." Within thirty seconds after he placed the order, the soybean market dropped ten cents a bushel. The chairman turned to look at the horrified expression on the analysts face. Calmly, he asked, "Now, where did you say the market was going to stop? If I can do that, anyone can."

The Probabilistic Mindset of Successful Traders | Mark Douglas

How can someone produce consistent results from an event that has an uncertain probabilistic outcome? To answer this question, all we have to do is look to the gambling industry. Casinos make consistent profits day after day and year after year, facilitating an event that has a purely random outcome. Shouldn't a consistent, nonrandom outcome produce consistent results, and a random outcome produce random, inconsistent results? 
 
"I just wait until there is money lying in the corner,
and all I have to do is go over there and pick it up.
I do nothing in the meantime.
"
Jim Rogers

What casino owners, experienced gamblers, and the best traders understand that the typical trader finds difficult to grasp is: events that have probable outcomes can produce consistent results, if you can get the odds in your favor and there is a large enough sample size. The best traders treat trading like a numbers game, similar to the way in which casinos and professional gamblers approach gambling. It's the ability to believe in the unpredictability of the game at the micro level and simultaneously believe in the predictability of the game at the macro level that makes the casino and the professional gambler effective and successful at what they do. 
 
 
Their belief prevents them from engaging in the pointless endeavor of trying to predict each individual outcome. They have learned and completely accepted the fact that they don't know what's going to happen next. More important, they don't need to know in order to make money consistently. Because they don't have to know what's going to happen next, they don't place any special significance, emotional or otherwise, on each individual hand, spin of the wheel, or roll of the dice. In other words, they're not encumbered by unrealistic expectations about what is going to happen, nor are their egos involved in a way that makes them have to be right. As a result, it's easier to stay focused on keeping the odds in their favor and executing flawlessly, which in turn makes them less susceptible to making costly mistakes.

A probabilistic mindset pertaining to trading consists of five fundamental truths:
  1. Anything can happen.  
  2. You don't need to know what is going to happen next in order to make money.  
  3. There is a random distribution between wins and losses for any given set of variables that define an edge.  
  4. An edge is nothing more than an indication of a higher probability of one thing happening over another.  
  5. Every moment in the market is unique.
 
See also:

Friday, March 17, 2023

How Livermore Judges the Turning Points | Richard D. Wyckoff

Judging the main turning points in the long swings is the most important thing that he does, and if he could accomplish nothing else in between the panics and booms and accurately judge the right time for changing his position, he knows that he has a starting point for the rolling up of tremendous profits during the intervening year or two while the market is on its way from nadir to zenith. It is perfectly clear why this is so. A man who loads up at the low point of a panic has a certain amount of working capital. If he succeeds in selling out near the top of the boom, he has not only his original capital but his aggregate profits as well. If he then takes a short position with the line increased by reason of these profits and successfully rides this short line down to the next panic, he will find his resources vastly increased.
 
Quotation Board Girls copying the latest numbers calculated by the
Composite Man to the quotation board
in Waldorf Astoria's lobby to be acknowledged by the crowd as
the price and nothing but the price; New York, 1918.
 
These lines of stocks which Livermore takes on at the low points are not of course, always sold at the topmost prices. As the market executes its series of intermediate swings and begins to approach the level when an important turning point is likely to occur, he looks for more frequent reactions, and, therefore, will very often liquidate all or part of his line on some of the strong bulges which occur in the upper stages of the market, or in what is known as the selling zone. He does not consider it good policy to try and get the last point, for many things can happen which might bring the ultimate turning point nearer than he anticipated. 
 
He knows that all stocks do not make their tops simultaneously. Some reach their apex months before the last of them have exhausted their lifting power. The bull forces may be likened to an army which is carrying the defenses of the enemy: it can advance just so far without becoming exhausted and falling back. He knows that the principal bull ammunition is money and that general conditions govern and limit the extent of any move; also that it is not so much the news, the statistics, the dividends, etc. that are important but what is of dominating importance is the effect of the developments on the minds of men and the extent to which traders and investors are thereby induced to buy or sell. The market is not affected by what a million people think about the market, but it is immediately affected by their actual buying and selling or their failure to do either. 
 
 
While the long swings are of the utmost importance to him, they do not by any means constitute all of his operations. He is an active trader, for long ago he cured himself of jumping in and out of the market day after day.  
 
Next in importance to the trades which he makes are the intermediate swings running from ten to thirty points and from a week or two to a few months in duration. Let us say that the market is getting into the upper levels and although not at the turning point becomes overbought and the technical position is such that a reaction of ten to fifteen points is imminent. He decides that under such conditions it is best for him to reduce his line of long stocks in order that he may take advantage of whatever decline occurs by replacing them at lower prices. He may have twenty or thirty points profit in a certain lot of stock which he believes will sell at a higher figure eventually, but if he can close this out on the verge of a sharp reaction and replace it ten points cheaper, he has thereby reduced the original cost by that much. His judgment of the time and the direction of these intermediate swings can only be formed accurately by the action of the market as recorded on the tape of the ticker. He cannot gauge it properly in any other way. Where else can he see the gradual alteration from strength to weakness in the market; the complete supply of the absorption power; the ultimate weakening of support and the numerous other characteristics of such an episode.

Wyckoff started as a stockbroker's runner at the age of 15,
became a brokerage firm auditor a few years later,
and at age 25 opened his own brokerage firm.

Just as the market displays to his practiced eye the downward phase, so it forecasts the end of the reaction and the time to resume the long side. These indications appear in the leading stocks of important groups and in many individual issues - usually the most popular trading mediums. The principles of judging the market by its own action, Livermore learned long ago and he found that they operate over the whole wide range of stock market movements, from the little half-hourly ripples back and forth to the great swings in prices running from one to three years. It is a question of supply and demand and once recognized and properly applied, it goes a long way toward solving of most stock market problems.


The market moves along the line of least resistance and when demand is greater than supply this line is upward. To detect the momentary changes as well as those taking a longer time to work out, is the daily task of Mr. Livermore, just as it is the business of every manufacturer and merchant to judge the future course of his particular industry.

 
See also:
Richard D. Wyckoff (1910) - Studies in Tape Reading.
Richard D. Wyckoff (1922) - Exposing and Killing the Bucket Shops. 
Edwin Lefèvre (1923) - Jesse Livermore - Reminiscences of a Stock Operator.
Edwin Lefèvre (1925) - The Making of a Stockbroker. 
Richard D. Wyckoff (1930) - Wall Street Ventures & Adventures through Forty Years.
 Richard D. Wyckoff (1931) - The Wyckoff Method of Trading in Stocks.