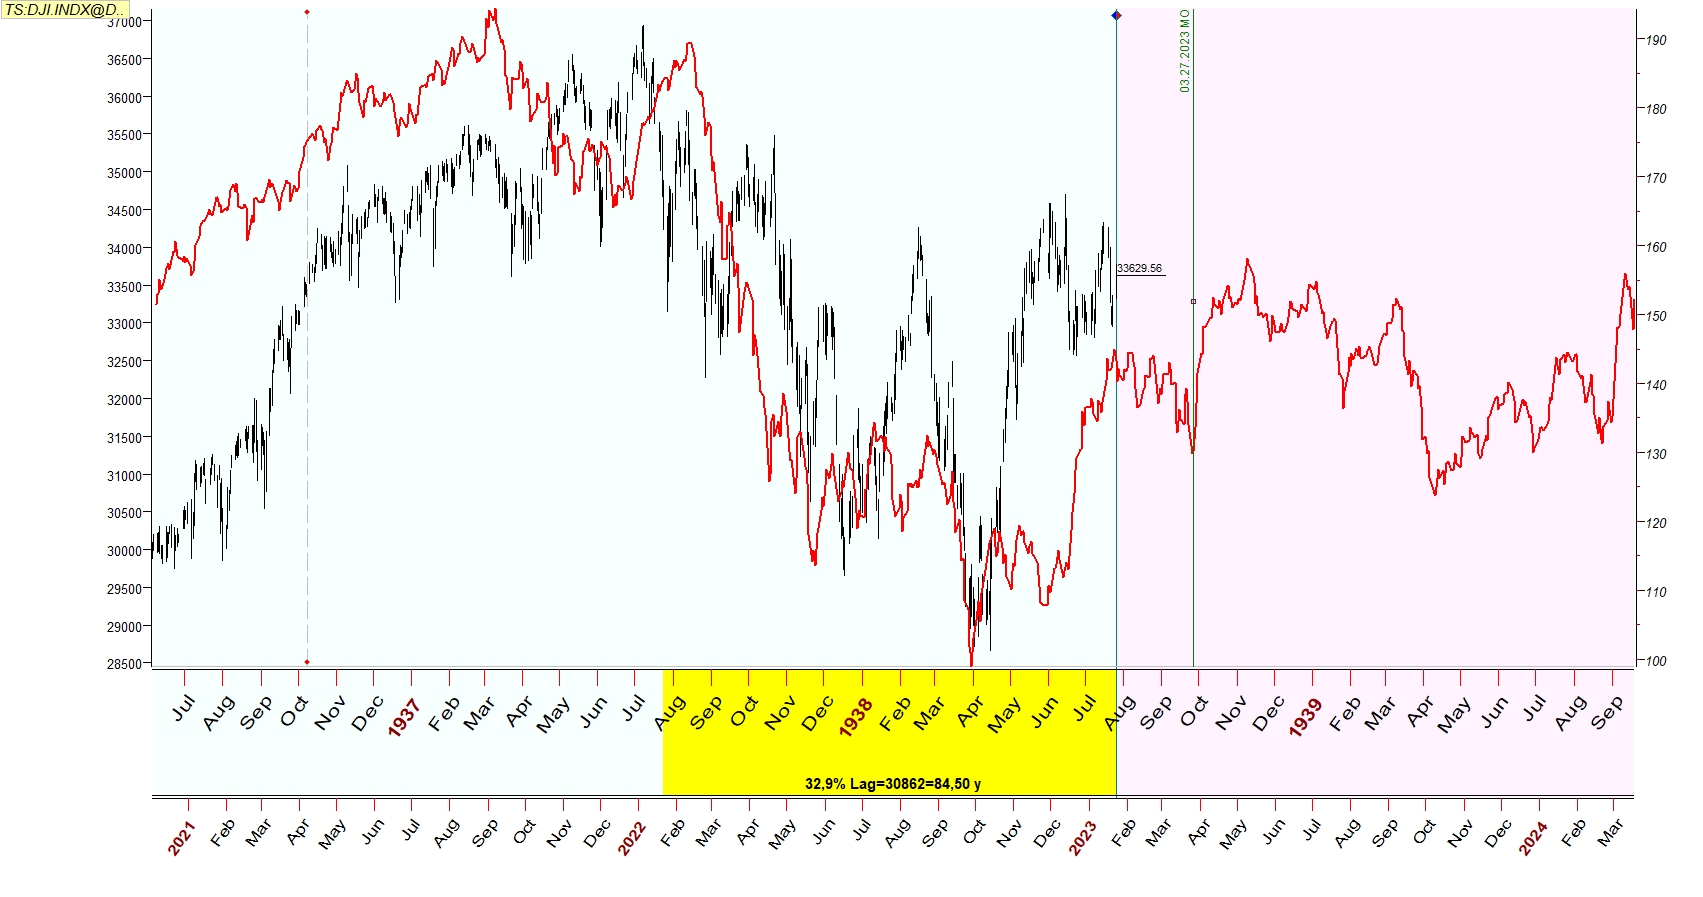
August established the multi-year high for the current cycle. On August 13 (Thu), the market peaked at 7,816.7, marking the dual 18-month and 40-week crest for the move that began at 4,835 in April 2025. This peak reflected mixed cycle translation: the 18-month cycle peaked late (at 77% of its duration), whereas the 40-week cycle peaked early (at 48%). A lesser secondary crest for the 80-day and 20-week cycles followed on August 28 (Fri) at 7,771.
From these highs, the market is trending downward toward a major nested trough projected for January 9 (Sat) 2027, which aligns the 18-month, 40-week, and 20-week cycles. Downside targets range from 7,148 on a standard 20-week retracement to approximately 6,500 if the full 40-week amplitude unfolds.
From these highs, the market is trending downward toward a major nested trough projected for January 9 (Sat) 2027, which aligns the 18-month, 40-week, and 20-week cycles. Downside targets range from 7,148 on a standard 20-week retracement to approximately 6,500 if the full 40-week amplitude unfolds.


Forward Projection & Confluence Calendar.

September: Initial Decline
September represents the first leg of this broader decline rather than a continuation to new highs. A 20-day trough printed on September 10 (Thu) at 7,580. Provided this support holds, the only remaining minor crests are a 5-/10-/20-day cluster on September 14 (Mon), September 15 (Tue), and September 18 (Fri) near 7,710. Subsequent low projections follow in close order, beginning with the 5-day low on September 16 (Wed), followed by the 10-day low on September 21 (Mon), and concluding with the 40-day low on September 26 (Sat), which marks the midpoint of the active 80-day cycle.
October: Continued Downside
October continues the downward trajectory rather than initiating a late-stage rally. The 80-day cycle—whose crest is already locked in at 7,771—is due to trough on October 31 (Sat) (with an expected window spanning October 24–Nov 7), following a breakdown below its Future Line Demarcation (FLD) on September 9. Initial measured support stands at 7,562, followed by the 20-week FLD at 7,482.
Alternate Cycle Projection
If the 7,482 (the July 31 close) support fails, an accelerated alternate resolution brings the 18-month low forward to October 5 (Mon) near 7,000, bypassing the January window entirely. There is no structural path to an October all-time high; the 8,469 projection went unfulfilled in August, and the 40-week cycle has already passed its crest.

Alternate composite, different nest: 18-month / short 40-week into Oct 5 (Mon) 2026, no
mid-October 40-week crest. Key dates: Next crest August 28 7,771.4 (40-day / 80-day / 20-
week already in), working 20-day bounce September 18 · ~7,710, then October 5 trough
~7,000. If October is a deep break instead of a moderate 80-day, this is the path.
With the 80-day uptrend breaking on September 9, this down-cycle represents an immediate risk tied to a one-third division of the major 54-month or 4½-year cycle that began in April 2025. Because that fractional cycle projection matures this fall rather than early next year, the market risks shifting into a deeper low target around October 5 (near 7,000) if the S&P closes under 7,482 before reclaiming 7,720.
While January remains the principal nested low under the condition that 7,482 holds, breaching that support level invalidates the January timeline, favoring a sharper autumn selloff over extended rangebound consolidation into the new year.


Current Cycle Positions.

See also:

S&P 500 spectrum composite forecast by Sergey Ivanov via Timing Solution (September 13, 2026).

Claudio Fialdini applies the Delta Phenomenon's super-long-term 19-year (228-month) and long-term cycles to the S&P 500, proposing 14 alternating waves of tops and bottoms culminating in a major peak and deep crash. Anchored to the Metonic cycle, historical turning points include 1929, 1947, 1966, 1987, and 2007, with Wave 14 projecting a terminal peak in 2026. Waves 1–13 comprise the secular advance; Wave 14 marks the final crest before liquidation. The green baseline traces cycle support through the 2009 GFC (Wave 1), 2011 (Wave 3), 2015–16 (Wave 5), and 2020 COVID (Wave 7) lows, followed by a projected decline toward the multi-decade trendline.


.jpg)