Showing posts with label Garth Allen. Show all posts

Friday, September 8, 2023

Cycles Write World History | Donald A. Bradley

Research embracing many fields of scientific pursuit and all available historical records proves that the climate of the earth as a whole goes through long cycles. World-climate shifts from cold to warm periods and from wet to dry periods with amazing regularity. Dry periods accompanied by colder weather take place about every 170 years, every third such “cold drought” being severe in its effects.
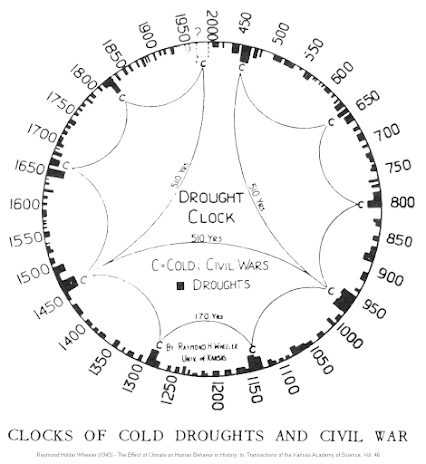
"The turning points between old and new civilizations occur when 
cold-dry times reach their maximum severity."

Professor Raymond H. Wheeler, eminent psychologist of the University of Kansas, heads this study project which finds an important correlation between world climate and political history. Dr. Wheeler's analysis of an immense accumulation of data shows that great international changes occur on these shifts from warm to cold and vice versa. Nations deteriorate on the shift from warm to cold, the study reveals. What is probably most fascinating among the findings is that totalitarianism is representative of world-wide political sentiment during warm periods. Democracy is vivified and sought after by men during cold periods. Intervals of cold droughts usually coincide with eras of civil wars. International wars are fought, for the most part, during warmer times. The Wheeler project has identified basic mass-psychological patterns with every climatic condition found in the global weather cycle. Public attitudes and popular ideas are directly colored by the general nature of the world-climate prevailing at any time.
 
Raymond H. Wheeler and his 'big book'.
 
Astrology offers a logical explanation for this 170-year rhythm in world activities. It is hardly a coincidence that every cold-drought is synchronized with one of the solar system's major planetary configurations. Called a great mutation in astrological parlance, a conjunction of the planets Uranus and Neptune occurs every 171 years, on the average. These conjunctions are within effective orb for 15 years before and after their central date of coming-together in the sky. This Uranus-Neptune cycle leaves a continuous impression on the unwinding scroll of world history in inciting those conditions in human and natural affairs described.

Central conjunctions of Uranus and Neptune took place in the A.D. years of 
110, 281, 453, 624, 796, 967, 1139, 1310, 1481, 1653 and 1824 [1906-10, 1993, 2078-81, 2165]

[The years cited mark the general centers of the 30-year influence at work. They are computed for the conjunctions in mean heliocentric longitude, and not for the apparent (geocentric) times of occurrence. The time-margin allowed for this difference is nearly a whole decade.]

Each of these epochs is at or near the dead center of a period of serious cold drought recorded in the annals of history and science. It is no surprise to the astrologer that lowered mean temperature, lack of much rainfall, political stress and civil war itself should be typical of our earth’s response to these vibrations. Uranian influences alone have long been recognized as revolutionary in action. Neptune is peculiarly associated with meteorological matters, and also with canons of idealistic thought. Astrologers are generally agreed that Neptune is the planet of “isms” and ideologies which provoke national and international changes of attitude. Uranus is disruptive in action and progressive in the long run. Neptune, on the other hand, is said to determine world sentiments which have an emotional base. Conjunctions of these divergent forces bring about the years of famine and civil strife which make and break the great economic and political structures we call nations.

The primary precipitation-and-temperature cycle is obviously connected with a particular interplanetary periodicity. There are dozens if not hundreds of other cycles in man’s social and natural environment which can be traced to similar causes. Relations of two or more planets to each other as viewed from the earth are called aspects. The positions of any moving heavenly body across the great star-sprangled backdrop of the sky are called transits. In astrology, we make use of the term transit to mean the location of a planet by the sign of the zodiac it occupies. Aspects and sign-transits of the various planets are the fundamental causes of cycles on earth. Although not actually zodiacal factors, the declinations of certain planets and changes in the elements of planetary orbits are found to be strong components in the astrological theory of world cycles.

Above and beyond true physical phenomena is the strange tendency of world affairs toward cycles which reflect the general connotations of successive zodiacal signs. This is apparent if one reconsiders the famous historical analyses of Oswald Spengler in the light of astrology. Spengler’s anthropomorphic outlines of spiritual, cultural and political “contemporary epochs” seem to follow a fascinating zodiac of characteristics, commencing each broad swing in mankind’s affairs with typical Aries qualities, and culminating it, after ten more eras, with Piscean attributes. The reason for this inclination is inexplicable, at the present, as no astronomical connection has been discovered.

Mention of such interesting matters lays the groundwork for our immediate subject — that of applying astrology as a calculable gauge of contemporary economic conditions.

Thursday, November 24, 2016

Bradley Indices | Geocentric + Heliocentric | 2017

Enlarge
Enlarge

The above Bradley Indices were created by combining all geocentric and heliocentric planetary aspects and declinations in numerical values for each day. Sometimes the changes in trend in these indices will fit incredibly with the market behavior. The direction of the indices aren't as important as the concrete trend change. Find more information on the Bradley Indices in Donald Bradley's original "Stock Market Prediction" and HERE.

Turn Days in the Geocentric and Heliocentric Bradley Indices 2017:

2016 Nov 25 (Fri) = High [geo]
2016 Nov 28 (Mon) = Low [geo] 

2016 Dec 09 (Fri) = High [geo]
2016 Dec 14 (Wed) = Low [geo] 

2016 Dec 28 (Wed) = High [geo]
2017 Jan 07 (Sat) = Low [geo]
2017 Jan 16 (Mon) = Low [helio]
 

2017 Jan 20 (Fri) = High [geo]
2017 Jan 23 (Mon) = High [helio]
2017 Jan 28 (Sat) = Low [geo + helio] 

2017 Feb 11 (Sat) = High [geo]
2017 Feb 19 (Sun) = High [helio]
2017 Feb 27 (Mon) = Low [geo + helio] 

2017 Mar 04 (Sat) = High [helio]
2017 Mar 06 (Mon) = High [geo]
2017 Mar 12 (Sun) = Low [geo]
2017 Mar 13 (Mon) = Low [helio]
 

2017 Mar 16 (Thu) = High [geo + helio]
2017 Mar 21 (Tue) = Low [geo+ helio] 

2017 Mar 28 (Tue) = High [geo+ helio]
2017 Apr 02 (Sun) = Low [geo+ helio] 

2017 Apr 19 (Wed) = High [geo + helio]
2017 Apr 26 (Wed) = Low [geo + helio] 

2017 May 11 (Thu) = High [geo+ helio]
2017 May 19 (Fri) = Low [geo + helio] 

2017 Jun 01 (Thu) = High [geo + helio]
2017 Jun 09 (Fri) = Low [geo + helio] 

2017 Jun 20 (Tue) = High [geo]
2017 Jun 22 (Thu) = High [helio]
2017 Jul 03 (Mon) = Low [geo]
2017 Jul 05 (Wed) = Low [helio]
 

2017 Aug 07 (Mon) = High [helio]
2017 Aug 09 (Wed) = High [geo]
2017 Aug 19 (Sat) = Low [geo]
2017 Aug 20 (Sun) = Low [helio]
 

2017 Aug 25 (Fri) = High [geo]
2017 Aug 29 (Tue) = High [helio]
2017 Oct 07 (Sat) = Low [geo]
2017 Oct 08 (Sun) = Low [helio]
 

2017 Nov 14 (Tue) = High [geo]
2017 Nov 19 (Sun) = High [helio]
2017 Dec 03 (Sun) = Low [helio]
2017 Dec 04 (Mon) = Low [geo]
 

2017 Dec 13 (Wed) = High [geo]
2017 Dec 14 (Thu) = High [helio]
2017 Dec 18 (Mon) = Low [helio]
2017 Dec 23 (Sat) = Low [geo]

 2018 Jan 03 (Wed) = High [geo]
2018 Jan 04 (Thu) = High [helio]
2018 Jan 28 (Sun) = Low [geo]
2018 Feb 01 (Thu) = Low [helio]

Wednesday, November 25, 2015

Bradley Indices | Geocentric + Heliocentric | 2016

Arch Crawford & Larry Pesavento (2002) - The Bradley model, described by Donald Bradley in his 1948 booklet ‘Stock Market Predictions’, has gained quite a bit of notoriety in recent years because of its incredible accuracy. Although the forecasts repeat with stunning regularity, it should not be construed as the “Holy Grail”. Long-term studies emphasize that it is a probability not a certainty. With that caveat, we will examine Bradley’s sidereal potential line as it takes into consideration every on of the classical Ptolemic harmonic angles between any 2 planet pairs.

Enlarge

Its strength and its weakness is that some years, it will precisely point up Highs, Lows and Turning dates for the Major Stock Market Indices, and other years will seem a random mishmash of useless squiggles. The Turning Dates are the most reliable portion of the Bradley, Direction, somewhat less so, and Amount of Move, least reliable. Sometimes a calculated High will, in reality, come about at a Low in stock prices and vice versa. In other words, it’s something we should keep our eyes on, but not something to Bet the Farm on, especially in a vacuum as in the absence of other technical confirmation from real-time data generated by the actual movements of prices on Wall Street. As Bradley so aptly described the model: “At no time must the reader gain the impression that a siderograph, as such, is a prediction of what the stock market will actually do. Nevertheless, observation proves that basic reversals in collective attitudes, clearly predicted by the line, are inevitably mirrored in stock averages. A limitation of the siderograph is that it cannot be construed as a forecast of secular trend. In statistical terminology, “lines of regression” fitted to the market course and to the potential should not be expected to completely agree, for reasons obvious to everybody with keen business sense or commercial training. The siderograph may be depended upon, though, to reward its analyst with foreknowledge of coming conditions in general, so that the non-psychological factors may be evaluated accordingly. By this we mean that the potential will afford one with clues as to how the mass mind will “take” the other mechanical or governmental vicissitudes affecting high finance.”

Enlarge

Not included in Bradley’s work are Syzgies (New & Full Moons) and their special cases, the Eclipses, Declination Factors (North - South positions, except for Mars & Venus), Heliocentric alignments and Large Configurations composed of Multiple Harmonic Interactions among several planets, simultaneously. When the Force is extra-ordinarily perturbed by any of these other factors, the Bradley projection can go totally away (see also HERE).

Turn days in the Geocentric and Heliocentric Bradley Indices 2016:


2015-11-25 (Wed)
Low (geo)
2015-11-06 (Fri)
High (helio)
2015-12-07 (Mon)
Low (helio)
2015-12-11 (Fri)
High (geo)
2015-12-12 (Sat)
High (helio)
2015-12-20 (Sun)
Low (geo)
2015-12-25 (Fri)
High (geo)
2016-01-04 (Mon)
Low (helio)
2016-01-06 (Wed)
Low (geo)
2016-01-13 (Wed)
High (geo + helio)
2016-01-18 (Mon)
Low (geo)
2016-01-19 (Tue)
Low (helio)
2016-02-03 (Wed)
High (helio)
2016-02-05 (Fri)
High (geo)
2016-02-17 (Wed)
Low (helio)
2016-02-19 (Fri)
Low (geo)
2016-02-24 (Wed)
High (geo)
2016-02-25 (Thu)
High (helio)
2016-03-10 (Thu)
Low (geo)
2016-03-12 (Sat)
Low (helio)
2016-03-25 (Fri)
High (geo)
2016-03-26 (Sat)
High (helio)
2016-04-04 (Mon)
Low (geo + helio)
2016-04-13 (Wed)
High (geo + helio)
2016-04-22 (Fri)
Low (geo + helio)
2016-05-10 (Tue)
High (geo + helio)
2016-06-02 (Thu)
Low (geo + helio)
2016-06-14 (Tue)
High (geo + helio)
2016-06-18 (Sat)
Low (geo + helio)
2016-07-05 (Tue)
High (geo + helio)
2016-07-11 (Mon)
Low (geo + helio)
2016-07-18 (Mon)
High (geo + helio)
2016-08-08 (Mon)
Low (helio)
2016-08-10 (Wed)
Low (geo)
2016-08-18 (Thu)
High (geo + helio)
2016-09-06 (Tue)
Low (geo)
2016-09-09 (Fri)
High (geo)
2016-09-18 (Sun)
Low (geo + helio)
2016-09-29 (Thu)
High (geo)
2016-09-30 (Fri)
High (helio)
2016-10-17 (Mon)
Low (helio)
2016-10-18 (Tue)
Low (geo)
2016-11-01 (Tue)
High (helio)
2016-11-03 (Thu)
High (geo)
2016-11-13 (Sun)
Low (helio)
2016-11-15 (Tue)
Low (geo)
2016-11-24 (Thu)
High (helio)
2016-11-25 (Fri)
High (geo)
2016-11-28 (Mon)
Low (geo)
2016-11-29 (Tue)
Low (helio)
2016-12-09 (Fri)
High (geo)
2016-12-10 (Sat)
High (helio)
2016-12-14 (Wed)
Low (geo)
2016-12-15 (Thu)
Low (helio)
2016-12-28 (Wed)
High (geo + helio)
2017-01-07 (Sat)
Low (geo)
2017-01-16 (Mon)
Low (helio)
2017-01-20 (Fri)
High (geo)
2017-01-23 (Mon)
High (helio)
2017-01-28 (Sat)
Low (geo + helio)

Monday, November 24, 2014

Geocentric and Heliocentric Bradley Indices 2015

This astro-forecasting tool was developed by Donald Bradley and published in 1947 in a booklet titled Stock Market Prediction. On the book-cover Bradley coined his tool the ‘Planetary Barometer’ and inside the book the ‘Siderograph’. Today it is simply called the ‘Bradley Index’. 


There are two versions of the index, a geocentric and a heliocentric one. Both attempt to forecast major and minor changes in the trend in stock markets indices. The Bradley Indices do not forecast highs or lows. Simply changes in the trend or non-directional turning-points. Donald Bradley wrote: 
[...] There are many [other] cycles affecting man with causes outside our immediate world. Well known among these is the electromagnetic cycle in biology which is caused by the relationship of the sun and the moon. Even tadpoles are seriously affected by this soli-lunar cycle which incidentially proves the wisdom of the oft-ridiculed practice of planting under various circumstances of the moon in the sky. What stimulates and pacifies the pollywog stimulates and pacifies the human being periodically.
“[...] At no time must the reader gain the impression that a Siderograph, as such, is a prediction of what the stock market will actually do. Nevertheless, observation proves that basic reversals in collective attitudes, clearly predicted by the line, are inevitably mirrored in stock averages.
(See also HERE)

[Eastern Standard Time (EST) -0500 UTC] 

Geocentric Bradley Index 2015
2014-11-20 (Thu) = Major Low
2014-12-09 (Tue) = High
2014-12-26 (Fri) = Low
2015-02-16 (Mon) = @ 0
2015-03-06 (Fri) = High
2015-03-11 (Wed) = Low
2015-04-03 (Fri) = High
2015-04-14 (Tue) = Low
2015-04-25 (Sat) = High
2015-05-04 (Mon) = Low
2015-05-10 (Sun) = High
2015-05-22 (Fri) = Low
2015-06-09 (Tue) = Major High
2015-06-20 (Sat) = Low
2015-06-28 (Sun) = High
2015-07-16 (Thu) = Low
2015-07-23 (Thu) = High
2015-07-29 (Wed) = Low
2015-08-03 (Mon) = High
2015-08-27 (Thu) = Low
2015-09-05 (Sat) = High
2015-10-01 (Thu) = @ 0
2015-10-09 (Fri) = Low
2015-10-26 (Mon) = @ 0
2015-11-08 (Sun) = High
2015-11-16 (Mon) = @ 0
2015-11-25 (Wed) = Low
2015-12-11 (Fri) = High
2015-12-20 (Sun) = Low
2015-12-25 (Fri) = High
2016-01-06 (Wed) = Low
2016-01-13 (Wed) = High
2016-01-18 (Mon) = Low
 
Heliocentric Bradley Index 2015
2014-11-22 (Sat) = Major Low     
2014-12-09 (Tue) = High   
2014-12-26 (Fri) = Low     
2015-02-10 (Tue) = @ 0
2015-03-04 (Wed) = High  
2015-03-12 (Thu) = Low    
2015-04-03 (Fri) = High     
2015-04-12 (Sun) = Low    
2015-04-24 (Fri) = High     
2015-05-04 (Mon) = Low   
2015-05-11 (Mon) = High  
2015-05-20 (Wed) = Low   
2015-06-09 (Tue) = Major High   
2015-06-21 (Sun) = Low    
2015-06-27 (Sat) = High    
2015-07-17 (Fri) = Low     
2015-07-21 (Tue) = High   
2015-07-30 (Thu) = Low    
2015-08-03 (Mon) = High  
2015-08-23 (Sun) = Low    
2015-09-03 (Thu) = High   
2015-09-24 (Thu) = Low    
2015-09-29 (Tue) = High   
2015-10-08 (Thu) = Low    
2015-11-06 (Fri) = High
2015-11-17 (Tue) = @ 0     
2015-12-07 (Mon) = Low   
2015-12-12 (Sat) = High    
2016-01-04 (Mon) = Low   
2016-01-13 (Wed) = High  
2016-01-19 (Tue) = Low    
 
Geocentric and Heliocentric Bradley Indices 2015
2014-11-20 (Thu) = Major Low (geo)
2014-11-22 (Sat) = Major Low (helio)   
2014-12-09 (Tue) = High (geo + helio)   
2014-12-26 (Fri) = Low (geo + helio)     
2015-02-10 (Tue) = @ 0 (helio)
2015-02-16 (Mon) = @ 0 (geo)
2015-03-04 (Wed) = High (helio)
2015-03-06 (Fri) = High (geo)
2015-03-11 (Wed) = Low (geo)
2015-03-12 (Thu) = Low (helio)   
2015-04-03 (Fri) = High (geo + helio)    
2015-04-12 (Sun) = Low (helio)   
2015-04-14 (Tue) = Low (geo)
2015-04-24 (Fri) = High (helio)    
2015-04-25 (Sat) = High (geo)
2015-05-04 (Mon) = Low (geo + helio)  
2015-05-10 (Sun) = High (geo)
2015-05-11 (Mon) = High (helio)
2015-05-20 (Wed) = Low (helio)  
2015-05-22 (Fri) = Low (geo)
2015-06-09 (Tue) = Major High (geo + helio)   
2015-06-20 (Sat) = Low (geo)
2015-06-21 (Sun) = Low (helio)   
2015-06-27 (Sat) = High (helio)   
2015-06-28 (Sun) = High (geo)
2015-07-16 (Thu) = Low (geo)
2015-07-17 (Fri) = Low (helio)    
2015-07-21 (Tue) = High (helio)  
2015-07-23 (Thu) = High (geo)
2015-07-29 (Wed) = Low (geo)
2015-07-30 (Thu) = Low (helio)   
2015-08-03 (Mon) = High (geo + helio)  
2015-08-23 (Sun) = Low (helio)   
2015-08-27 (Thu) = Low (geo)
2015-09-03 (Thu) = High (helio)  
2015-09-05 (Sat) = High (geo)
2015-09-24 (Thu) = Low (helio)   
2015-09-29 (Tue) = High (helio)  
2015-10-01 (Thu) = @ 0 (geo)
2015-10-08 (Thu) = Low (helio)   
2015-10-09 (Fri) = Low (geo)
2015-10-26 (Mon) = @ 0 (geo)
2015-11-06 (Fri) = High (helio)
2015-11-08 (Sun) = High (geo)
2015-11-16 (Mon) = @ 0 (geo)
2015-11-17 (Tue) = @ 0 (helio)    
2015-11-25 (Wed) = Low (geo)
2015-12-07 (Mon) = Low (helio)  
2015-12-11 (Fri) = High (geo)
2015-12-12 (Sat) = High (helio)   
2015-12-20 (Sun) = Low (geo)
2015-12-25 (Fri) = High (geo)
2016-01-04 (Mon) = Low (helio)  
2016-01-06 (Wed) = Low (geo)
2016-01-13 (Wed) = High (geo + helio)  
2016-01-18 (Mon) = Low (geo)
2016-01-19 (Tue) = Low (helio)