Pages

Monday, July 28, 2025

The Art of the $1.3 Trillion 'Screw You' Deal: EU Pays Up, US Gives Nothing

The $1.3 trillion US–EU trade agreement, reached after a tense 40-minute meeting held between US President Trump and President of the European Commission Ursula von der Leyen at Trump’s Scottish golf course on July 27, avoids a full-blown trade war. 
 
Trump celebrates his "biggest trade deal" yet.
 
As expected, Brussels, the tribute-bound US vassal, folded under pressure, and the circus ringmaster turned European diplomacy into an intergalactic howler: The EU accepted a 15% US tariff on its exports—while the US kept zero tariffs in return. Europe agreed to invest $600 billion into the US economy, pledged to buy hundreds of billions' worth of overpriced American weapons, and committed to $750 billion in US LNG purchases—$250 billion over the next three years alone—because apparently that's better than cheap gas through Nord Stream. In exchange, the US gave... absolutely nothing.
 
Von der Leyen, "You're known as a tough negotiator and dealmaker." Trump, "But fair." 
Von der Leyen, "And fair." Trump adds, "That's less important." Room erupts in laughter.
 
This 'screw you' deal and EU bailout for the US is seen as an absolute geopolitical and geoeconomic win for Trump, reinforcing his strategy of tariff threats and pressure, echoed in recent deals with Japan, Vietnam, and others.  
 
Brussels' Barbie—Trump’s total contempt: incompetent, corrupt, compromised.
 
Marine Le Pen, a veteran right-wing politician from France, calls the deal a political, economic, and moral "fiasco", and "an outright surrender for French industry and for our energy and military sovereignty"; Russian Foreign Minister Sergey Lavrov predicts "it will accelerate Europe’s deindustrialization".
 
Reference:
 
It is difficult, indeed.

S&P 500 and NASDAQ Close to 40-Day Hurst Cycle Peak | David Hickson

The S&P 500 formed an 18-month cycle trough in early April 2025, followed by an 80-day cycle trough on June 23, and a recent 40-day cycle trough on July 16. A 20-week cycle trough is anticipated around mid-August, with the 20-week cycle FLD expected to provide support. 
 
S&P 500 (daily bars): Expect a 40-day cycle peak soon, and a mid-August 20-week cycle trough.

The market is currently in a bullish trend, forming a second 40-day cycle peak soon, after which it should decline into the 20-week trough. Shorter cycle FLDs (5-day, 10-day, 20-day, 40-day, 80-day) will be monitored for peak confirmation and to generate downside targets. The trough may form above the 20-week FLD due to the bullish trend.

The NASDAQ also formed an 18-month cycle trough in the April, and an 80-day cycle trough in mid-June. A second 40-day cycle peak is expected soon, followed by a decline into a 20-week cycle trough in mid-August, with support at the 20-week FLD.
 
 NASDAQ (daily bars), same as in the S&P: 40-day cycle peak soon, 
and a rather shallow mid-August 20-week cycle trough.

Shorter cycle FLDs will be watched for peak confirmation. No significant changes have occurred since the last update, and both indices are expected to follow similar cycle paths.
 
Gold was potentially forming a significant cycle peak, possibly an 18-year cycle peak, around mid-April of 2025, but without confirmation, as its price moves in a contracting wedge and lacks the typical sharp, isolated peaks. 
 
Gold (weekly bars): 18-year peak likely still ahead (allow 1-2 years of leeway). 

Hence, doubts persist about the 18-year peak, with suggestions the April 22 high may be a 20-week or 40-week peak instead, the true 18-year peak likely still ahead due to cycle variation allowing a year or two of leeway. A 40-week cycle trough formed on May 15, and an 80-day cycle trough is expected in early August, with the price crossing below the 20-day FLD, targeting around $3,250, followed by a potential bounce. 
 
Bitcoin saw the 18-month cycle trough in August 2024 (the first in the current 54-month cycle), and a 40-week trough in April 2025, where the cycle FLD provided support. 
 
Bitcoin (weekly bars): next 18-month cycle trough by year-end
or early 2026 (the second in the current 54-month cycle).
 
A 20-week cycle trough is expected in mid-to-late August, with a peak possibly already formed or imminent, followed by a slight decline into the trough before an 18-month cycle trough anticipated by year-end or early next year.

 
See also:
Why long-term peaks don't always coincide with long-term cycles.
  
J.M. Hurst's Nominal Model consists of a series of sinusoids that, when summed, create a composite model, represented by the thick black line of the 18-month cycle in the chart below: The orange line is the 18-month cycle (17.93 months = 546.6 calendar days), the light green the 40-week cycle (9 months = 38.97 weeks = 272.8 days), dark green the 20-week component (4.5 months = 19.97 weeks = 136.4 days), light blue the 10-week cycle (= 68.2 days), dark blue the so called 40-day or 5-week cycle (= 34.1 days) and finally the so called 20-day cycle (17 days) is the purple sinusoid. The X axis represents the number of calendar days. 
  
18-Month Cycle Projection for the S&P 500 based on J.M. Hurst's Nominal Model.
 
The wavelengths are average values rather than exact measurements, and the thick black composite line ignores the effects of both the trend and cycles shorter than 20 days or longer than 18 months. Assuming the US stock market operates with clockwork precision, the dates for peaks and troughs in the above 18-Month Cycle Projection for the S&P 500 were calculated based on the 18-month cycle trough on April 7, 2025, and the aforementioned average cycle lengths. More context HERE & HERE.

S&P 500 Likely Topping 40-Week Hurst Cycle This Week | Krasi

The pattern is on track to complete this week at week 34, in line with the projected 40-week cycle high (typical range: 32–36 weeks). Market breadth is deteriorating, with persistent negative divergences confirming a sell bias.

An ideal impulsive structure in wave C or Y suggests that the market is nearing the end of a five-wave impulsive move
(waves 1 through 5) within either wave C of a corrective pattern (e.g., a zigzag or flat) or wave Y of a complex correction
(e.g., a triangle or double/triple three).

This likely marks a significant top—at minimum a 40-week high—with increased probability that it’s the 4-year cycle peak. Minor waves 4 and 5 remain to complete, potentially finalizing an ideal impulsive structure in wave C or Y, thus terminating the broader pattern.

Reference:
Krasi (July 28, 2025)  - Quick Update.

Every dip's a wave—until it’s not.

See also:

Friday, July 25, 2025

August 2025 Post-Election Year Seasonality of US Stock Indexes | Jeff Hirsch

August was the best DJIA month from 1901–1951, driven by agriculture and farming. Since 1988, however, it has become the worst month for DJIA and Russell 2000, and the second worst for S&P 500, NASDAQ, and Russell 1000, with average returns from +0.1% (NASDAQ) to –0.8% (DJIA). In August 2022, all major indexes fell over 4%; in 2023, losses exceeded 1.8%.
 
Down from August 1 (Fri) into August 8 (Fri), 
mid- to late-month sideways to down, up into month end.

Since 1950, in post-election years (dashed lines in chart above), August typically starts strong with average gains in the first two trading days, then declines until shortly after mid-month. A rebound of varying size and length usually follows, before major indexes end the month in choppy or sideways trading.
 

The S&P 500 rises steadily through July (blue STA Aggregate Cycle), 
peaks in early August, and pulls back into late August.
 
In post-election years, August has been even weaker: it’s the worst month for DJIA and Russell 1000, second worst for S&P 500, NASDAQ, and Russell 2000. Average losses range from –0.5% (Russell 2000) to –1.5% (DJIA), with more down Augusts than up across all indexes.
  
Reference:
 
 
Bank of America (BoA) analyst Paul Ciana highlights a historical S&P 500 trend since 1928, where the average trend tended to be frontloaded in July, peaking by the end of August and correcting lower in September. However, since 2015 a similar pattern with a mid-August peak developed while the median trend sees a late September peak.


The summer doldrums (late June to early September) typically see 20-40% lower trading volumes and variable volatility due to reduced market participation. Equities, bonds, commodities, and forex show subdued activity, with occasional volatility spikes due to low liquidity, and, in August 2025, possibly from more US tariffs craze and geopolitical events. 
 
  
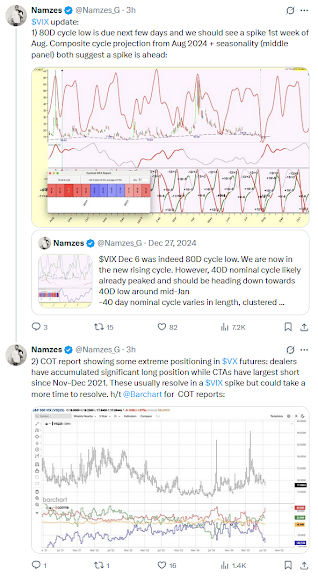
The latest Commitment of Traders (COT) report (see above) reveals extreme positioning in VIX futures, with dealers (= banks, broker-dealers, intermediaries managing risk from client trades, not speculating) holding substantial long positions and CTAs (= hedge funds, who are on the other side of the trade, typically as speculators) showing their largest short exposure since November–December 2021—a pattern that has frequently preceded spikes in the VIX. This unusual market setup suggests potential volatility in early August 2025 and aligns with Namze's forecast of an 80-day cycle low in the VIX during that period. However, the resolution may be delayed due to the scale of the positioning. 


According to BofA Global Research, the average US Presidential Cycle Year 1
(1928-2024) peaks in July and falls around 8% by year-end.
 
A seasonal cycle analysis by Ned Davis Research on the 2025 S&P 500 composite—blending the standard seasonal, 4-year Presidential, and 10-year decennial cycles—projects a current peak, choppy action through October, a late-year drawdown,
and a strong Q4 rally. August and September appear as potential weak spots.

 Bitcoin Seasonal Pattern 2018-2024 vs 2025.
 

See also:

Cosmic Cluster Days | August 2025

Heliocentric Cosmic Cluster Days (CCDs) and financial markets do not display a consistent polarity or directional bias. The 'noise channel' serves as a signal filter, with the upper and lower limits of the channel being empirically defined. That said, swing directions, along with swing highs and lows also within the 'noise channel,' may correlate with or coincide with short-term market trends and reversals.
 
  Cosmic Cluster Days  |   Composite Line  |  Noise Channel 
  = Full Moon | = New Moon |   = Lunar Declination max North and  = max South立春Solar Terms
 
Cosmic Cluster Days in August 2025:
 Jul 30 (Wed) | Aug 13 (Wed) | Aug 18 (Mon) | Aug 24 (Sun) | Sep 08 (Mon)
  
For previous CCDs, click [HERE]. For background on the author, the concept, and the calculation method, click [HERE].
 
Geocentric and Heliocentric Bradley Turning Points, click [HERE]. 
Sensitive Degrees of the Sun, click [HERE].
Planet Speed (Retrogradity), click [HERE].   
Planetary Declinations, click [HERE].
Lunation Cycle, click [HERE].  

The SoLunar Rhythm in August 2025.
 
Mercury at Inferior Conjunction on Thursday, July 31, 2025 at 19:36 EDT.
Mercury at Greatest Elongation on Tuesday, August 19, 2025 at 5:59 EDT.
Mercury at Perihelion on Wednesday, August 27, 2025 at 08:23 EDT.
Total Lunar Eclipse on Sunday, September 7, 2025 at 14:11 EDT.

89 Seconds to Midnight on the Doomsday Clock | Jeffrey Sachs

There are nine countries known to possess nuclear weapons. Perhaps more do, but nine are confirmed. Most of these countries are in geopolitical or diplomatic conflict with at least one other nuclear power. In the case of the United States and Russia, they are in open conflict—specifically in Ukraine—which is in fact a war between the US and Russia, and an extremely dangerous one. 

The world is sick of the US, Zionism, and I$raHell.


We must understand the global scene clearly in order to avoid terrible, potentially catastrophic mistakes. The US seems unable to accept a world in which it is no longer the sole superpower. But that era is over. The future is multipolar. The sooner Washington accepts this, the safer we will all be.
 
I often refer to the Doomsday Clock created by the Bulletin of the Atomic Scientists—a US publication founded in 1947 after the US atomic bombings of Hiroshima and Nagasaki. [...] When the clock was first introduced, it was set at 7 minutes to midnight. [...] Today, the clock stands at just 89 seconds to midnight.

US Secretary of State Marco Rubio described Gaza’s residents as "vicious animals." 
When asked whether he would call for a ceasefire, Rubio replied, "I will not do that."
21st-century Nazism or plain and simple Zionism?
 
The US sees every conflict as a zero-sum game—one side must win, and the other must lose. There is no room for compromise, coexistence, or mutual respect. But the world doesn’t work that way. In our deeply interconnected and nuclear-armed world, we must find ways to cooperate—even with rivals.

The US needs to abandon its imperial mindset and embrace a new paradigm: one based on multipolarity, mutual respect, and the rule of international law. That is the only path to peace—not just in Ukraine or the Middle East, but globally. And I believe China has an important role to play in this transformation.
 
China has consistently advocated for a multipolar world, a peaceful international order, and respect for sovereignty. These are not just slogans; they are the foundation for a workable global system in the 21st century. China’s own development since 1980 has shown that economic progress does not require military aggression. Instead, China has focused on infrastructure, education, trade, technology, and long-term planning.


The Belt and Road Initiative, launched over a decade ago, has helped dozens of countries—especially in the Global South—gain access to much-needed infrastructure. Rather than exporting war, China is exporting railways, highways, ports, and power grids. That is a model the world needs. But unfortunately, the United States sees China’s rise not as a positive development, but as a threat.

Washington policymakers talk about “decoupling,” “containment,” and even “strategic rivalry.” They send warships through the Taiwan Strait and arms to Taipei. They push military alliances in the Pacific and increase military budgets, all in the name of “competition.” But what does that competition really mean? If it’s about innovation, education, clean energy, and development—then fine. Let’s compete to build a better world. But if it’s about military encirclement, economic warfare, and ideological confrontation—then we are heading toward disaster. 

Monday, July 21, 2025

100% Chance of Nuclear War as Early as August │ Martin Armstrong

Six weeks ago, financial and geopolitical cycle analyst Martin Armstrong was signaling a major turn toward war. Now, Armstrong says, "The chances of war with a nuclear exchange are at 100%. Plan on it—this is coming."

» The chances of a war involving a nuclear exchange are at 100%. 
Plan for it—this is coming. Starting in August, this whole situation is going to escalate.  «
 
Can the world avoid nuclear war with President Trump’s 50-day deadline given to Russia to make peace in Ukraine? Armstrong says, "You do not threaten your adversary, who is at your same level, publicly. If you want to say something like that, you do it privately in a phone call. Now, what will happen is Putin cannot possibly sign a peace deal. What—are you crazy—to do this in 50 days? We have staff in Germany, and I was told by my staff that a 60-year-old friend was told to report for duty. 
 
»
There is a 100% chance that NATO will trigger a total nuclear war within the next year. «
Martin Armstrong, July 23, 2025.
 
I had a friend who was at the NATO 'Summit on Peace in Ukraine' in Switzerland, and he called me when it was over and said, ‘Holy crap, this has nothing to do with peace anymore. This is all about preparing for war. Everybody should start getting ready for drafts, to start going that way.’ They want war. They are not backing off."

 » They want war. They are not backing off. «
 
Armstrong’s computer, Socrates, is signaling war as early as next month. Armstrong says, "Starting in August, this whole thing is going to be escalating up. Our computer has what we call a ‘Panic Cycle’ within our war cycles for 2026. That is not good. I don’t know what the hell Trump is smoking. My computer has been projecting war, and it is projecting war going into 2026. This is not looking good, and Europe will lose. It is as simple as that."

Saturday, July 19, 2025

"Bull Hook" Toby Crabel Price Pattern in the S&P 500

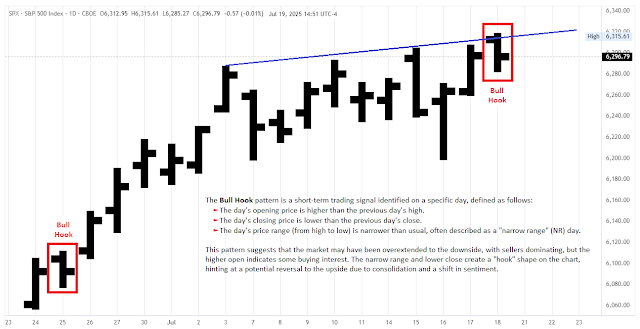
The Toby Crabel Bull Hook pattern, present on July 18 (Fri), in the S&P 500 Cash Index, implies a potential short-term upward move for trading starting July 21, 2025. 
 
A Bull Hook happens when a bar has a lower range than the previous one, with its opening price
higher than the previous bar’s high and its closing price lower than the previous bar’s close.
 
Price action created the narrowest range of the last 8 days with a lower daily close. The daily bar has a "hook" shape (a bull flag on lower timeframes), hinting at a potential reversal to the upside due to consolidation and a shift in sentiment. The Bull Hook pattern is generally bullish, opening above the previous day's high and closing lower with a narrowing range. It's often followed by upward price moves in the days after. 
 
A recent analysis by Ali Casey provides additional insights. The Bull Hook pattern has limitations, including its better performance in trending or volatile markets, the potential for false signals and losses in some cases, and its reliance on precise execution, which can be influenced by news or macroeconomic events.
 

Friday, July 18, 2025

Simple ICT Day Trading Strategy That Works Every Day │ JadeCap

This trading strategy focuses on entering positions based on significant daily highs and lows, utilizing ICT's "Power of Three" framework—accumulation, manipulation, and distribution. With this approach, I earned $4.5 million and I’m here to show you how simple it can be: 
 
» Do not trade if the market has already hit the target high/low. «
 
The Key is to target historical levels beyond just the last 24 hours and to use the New York midnight open for optimal entry points. By staying committed to the market direction from the previous day and timing your trades around key sessions like New York or London (ICT Kill Zones), you can capture manipulation moves for more favorable risk-to-reward ratios. 
 
» I’m here to show you how simple it can be. « 
 
Now, I'll walk you through the three-step process I use to achieve results every day:

1.) Identify Key LevelsDetermine the previous daily high or low as the target based on bullish or bearish conviction from prior day’s close.
2.) Assess Market Context: Confirm the market is trading below the previous daily high (for bullish trades) or above the previous daily low (for bearish trades) to avoid chasing price.
3.) Apply Power of Three:
Accumulation: Identify a range (e.g., Asian or London session) where orders build up.
Manipulation: Look for a temporary move against the expected direction (e.g., bearish move in a bullish setup) to trap traders.
Distribution: Enter trades as the market moves toward the target high/low, ideally near the midnight open for better risk-to-reward.


Entry and Risk Management
:
  • Enter trades on lower time frames (e.g., hourly) using setups like fair value gaps, order blocks, or liquidity raids that align with the high time frame direction.
  • Place stop losses logically (e.g., at 50% of a Fair Value Gap or below a key level).
  • Exit trades based on time (e.g., end of a 4-hour candle) or when the target is reached, avoiding overnight holds for futures.
Avoid Common Pitfalls:
  • Do not trade if the market has already hit the target high/low.
  • Avoid setups misaligned with the high time frame direction.
  • Trade smaller or not at all if the market has expanded in your direction before entry.
Reference:


See
 also: