July begins NASDAQ’s worst four months but is also the seventh best performing NASDAQ month since 1971, posting a 0.9% average gain. Lively trading often accompanies the first full month of summer as the beginning of the second half of the year tends to bring an inflow of new capital.

Typical Post-Election Year July: Early Strength, Beyond Mid-Month Mixed.
Reference:
Jeffrey A. Hirsch (June 25, 2025) - Typical July Trading: Strength Early, Beyond Mid-Month Mixed.
Jeffrey A. Hirsch (June 25, 2025) - Typical July Trading: Strength Early, Beyond Mid-Month Mixed.
Data
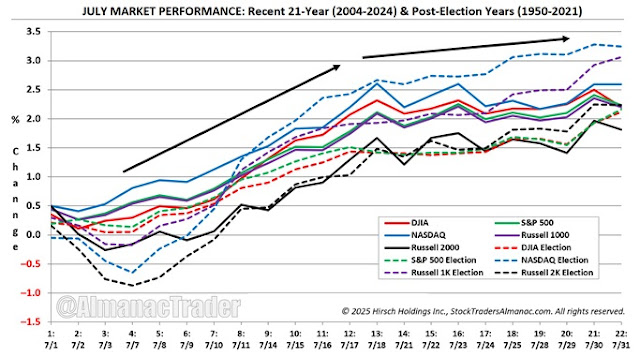
from the Stock Trader’s Almanac are showing that since 1950, July has
been the strongest month for both the DJIA and the S&P 500 in post-election years.
Specifically, the DJIA has averaged a 2.1% gain, ranking first among
months, with 15 positive years and only 3 negative years. The S&P
500 mirrors this, averaging a 2.2% gain, also ranking first, with 12
positive and 6 negative years.
This covers 19 presidential election
cycles from 1952 to 2020, providing a robust dataset spanning post-war
booms, recessions, and technological shifts. A
notable statistic is the 10-year streak of positive July returns for
both indices from 2015 to 2024, suggesting a recent intensification of
this seasonal pattern. The table below summarizes the performance:


Post-Election Years with 1st-Term Democrats +14%, 1st-Term Republicans +1%.


See also: