Pages

Monday, June 25, 2012

STD Yellow Week (June 25-29)


This coming week will be a Short-Term-Delta Yellow Week with a yellow Monday and a yellow Friday. Last Friday, June 23rd, the SPX closed near the day's high and we expect the STD-pattern to continue without inversion. Then this week should be tracing out some sort of a choppy W-shape. And according to the STD-Theory Monday-Tuesday should repeat last Thursday-Friday:
DOWN from a Monday (June 25) morning HIGH (high of the week) into the close of Tuesday June 26 (low of the week).    
This pattern makes sense even more since last Friday was a NR7-day (see HERE). However, other cycle projections suggest that the week's pattern would be as follows (see HERE + HERE + Mike Korell's ChartEdge-forecast below):
chopping up into the week's HIGH on Tuesday June 26, from there hard down into the low of the week on Wednesday June 27, a turn day
The Weekly Pivot-Point and Support-Resistance-Levels for the E-mini S&P 500 September are: 
R3 1,352.75
R2 1,344.25
R1 1,340.50
PP 1,335.75
S1 1,332.00
S2 1,327.25
S3 1,318.75
S4 1,310.25
STD Blue- and STD Yellow-days and -weeks are choppy and reportedly hard to trade, and some ST- traders recommend to go fishing instead. This notion is supported by the forthcoming Astro-Events suggesting potential CITs for almost every day:
2012-06-23-26 (Sat-Tue) = Tidal CIT
2012-06-25 01:42 (Mon) = SAT (D) = Merriman Level 1 - Turnday
2012-06-25 02:25 (Mon) = JUP 90° NEP = Merriman Level 1 - Turnday
2012-06-27 00:00 (Wed) = MAR 90° Galactic Center
2012-06-27 10:05 (Wed) = VEN (D) = Level 1 = Merriman Level 1 - Turnday
2012-06-28-29 (Thu-Fri) = Tidal CITs
2012-06-29 00:00 (Fri) = AI-CIT - Value = 7
2012-06-29 09:44 (Fri) = SUN 180° PLU = Merriman Level 3 - Turnday
2012-06-29 15:00 (Fri) = SUN 90° URA  = Merriman Level 1 - Turnday


www.chartsedge.com


www.alpheefinance.com


Tony Caldaro's Weekend Update (June 23, 2012) 
The recent rally from SPX 1267 to 1363 started off impulsively as it was unfolding. We were expecting the rally to reach either the 1363 or 1372 pivots in a five wave sequence ahead of the FOMC meeting. The pattern, unfortunately, looked like three waves on tuesday as the FOMC began. After tuesday’s high, and wednesday’s volatility, the market sold off on thursday to SPX 1324. This selloff overlapped the first rally from SPX 1267 to 1329/36. This made the entire June rally look corrective. As a result we have labeled the SPX 1267 low as a wave A, and the recent rally as a wave B. The most probable scenario suggests a wave C is underway to either retest the June lows or make a lower low in early July.

Dan Eric's Elliott Wave Update (22 June 2012)

www.danericselliottwaves.blogspot.com 
It would be ideal for the wave structure if Monday made a quick lower low beneath Thursday's low prior to any retrace into 1346 - the bottom of wave i. This would complete a small 5 wave pattern down from the recent rally high peak of 1363.46.


Saturday, June 23, 2012

SLTD Roadmap - Big Delta Picture

Quite a few fundamental and technical odds seem to be against the following SLTD projection, and E-wavers predict the third-of-the-third-wave anew these days. However, the 40 Year Cycle worked well so far and suggests a rally with a higher HIGH in late August before declining into May 2014.   
2012-06-26 (Tue) = High
2012-06-27 (Wed) = Low
2012-07-03 (Tue) = High
2012-07-04 (Wed) = Low
2012-07-30 (Mon) = High
2012-08-08 (Wed) = Low
2012-08-29 (Wed) = High

See HERE & HERE & HERE

# 10 in this chart = # 16 in the chart below


www.alphee.com

SPX vs Delta - VIX - Tides - Astro-Indicators - EW

Roadmap:
2012-06-26 (Tue) = High
2012-06-27 (Wed) = Low
2012-07-03 (Tue) = High
2012-07-04 (Wed) = Low
2012-07-30 (Mon) = High
2012-08-08 (Wed) = Low
2012-08-29 (Wed) = High


The Option Strategist Weekly Updater 6/22/12  
http://www.optionstrategist.com/blog/2012/06/weekly-commentary-6222012  
The stock market had just about everything going for it in technical terms this week, but then the fundamentalists delivered a nasty blow today (Thursday, June 21st). Technically $SPX is just below the support level of 1330-1340.
Equity-only put-call ratios remain on buy signals, despite Thursday's large decline.
Market breadth was very poor on Thursday. As a result, both breadth oscillators registered sell signals.
Volatility indices ($VIX and $VXO) were the last indicators to turn positive earlier this week. That occurred when $VIX fell below 21 on Monday and then proceeded to drop to 17 by mid-week. As we have been saying for some time, $VIX above 21 is bearish for stocks, while $VIX below 21 is bullish.
In summary, the technical indicators remain bullish, except for breadth. We are going to give the upside the benefit of the doubt. But if $SPX should decline further, or if $VIX should close above 21, or if the put-call ratios should roll over, then we would have to relinquish our currently bullish stance. 

Tony Caldaro's Weekend Ppdate (June 23, 2012) 
The recent rally from SPX 1267 to 1363 started off impulsively as it was unfolding. We were expecting the rally to reach either the 1363 or 1372 pivots in a five wave sequence ahead of the FOMC meeting. The pattern, unfortunately, looked like three waves on tuesday as the FOMC began. After tuesday’s high, and wednesday’s volatility, the market sold off on thursday to SPX 1324. This selloff overlapped the first rally from SPX 1267 to 1329/36. This made the entire June rally look corrective. As a result we have labeled the SPX 1267 low as a wave A, and the recent rally as a wave B. The most probable scenario suggests a wave C is underway to either retest the June lows or make a lower low in early July.

Elliott Wave Update ~ 22 June 2012 
http://danericselliottwaves.blogspot.de/2012/06/elliott-wave-update-22-june-2012.htmlIt would be ideal for the wave structure if Monday made a quick lower low beneath Thursday's low prior to any retrace into 1346 - the bottom of wave i. This would complete a small 5 wave pattern down from the recent rally high peak of 1363.46.

Wednesday, June 20, 2012

SPX vs 354 CD Cycle = June 22-25 High

The S&P 500 is in line with the 354 CD Cycle, and a major HIGH is due around June 22-25. 
Also looking back one and four lunar months, especially on the last STD Green Week (see here: May 21-25, 2012), a choppy sideways-action is expected for this STD Wednesday and Thursday.


www.danericselliottwaves.blogspot.com

Sunday, June 17, 2012

STD Green Week (June 18-22)

Last week was a perfect Short Term Delta Red Week in an up bias.

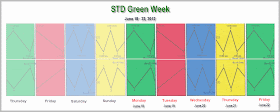
This week is a STD Green Week, because Monday, June 18th will be a STD Green Day (see HERE).  


STD Green Days 66% of the time look like N's (or inverted N's). Look for a top around 11:00 and a down move into 13:00. So one might sell/buy a confirmed intraday top/low around 11:00 - 11:30. Not sure if afternoon green 15:00 CITs are as or more a reliable buy/sell but watch out to be out before 15:00 for the closing up- or down-leg of the "N".

Green Weeks are usually almost the same as Red Weeks = directional. However, Green Weeks often have CITs on early Tuesdays and on Thursdays. If Tuesday is biased up, then the odds increase for Wednesday and Thursday to be up as well. Tuesday to Thursday usually will reverse Monday's net move. 


New Moons oftentimes mark CITs, and Tuesday, June 19th, could be either the High or the Low of next week. The same day will be marked by the Moon's declination reaching max north, and a Berg Astro-Indicator CIT.
 

And last not least, a Green Friday should look like the Green Monday.


Wednesday, June 13, 2012

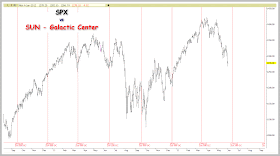
SPX vs SUN 120° SATURN = June 13 HIGH ?

Calculated with Sergey Tarassov's Timing Solution

Tuesday, June 12, 2012

Monday, June 11, 2012

STD Red Week (June 11-15)

A normal Red Week will have Monday down into the close +/- and the rest of the week up with the red Friday either being up or being a normal H to L.  
 
Red Weeks are 65% chance of Tue-Fri running opposite of Monday's close. If Monday closes up then there's a 65% chance Tuesday - Friday will be down. 35% chance that the week will continue the direction set by Monday.

The chart below shows back increments of 4 weeks from today (= red Monday - see also HERE and HERE) highlighting recent red week-price patterns. 


Sunday, June 10, 2012

Delta Update


Tidal CITs @ Willets Point [NYC] 
2012-04-18-19 (Wed-Thu)
2012-04-27-29 (Fri-Sun)
2012-05-07 (Mon)
2012-05-13-14 (Sun-Mon)
2012-05-18 (Fri)
2012-05-21-22 (Mon-Tue)
2012-05-24-25 (Thu-Fri)
2012-05-29 (Tue)
2012-06-05 (Tue)
2012-06-13-14 (Wed-Thu)
2012-06-16 (Sat)
2012-06-23-26 (Sat-Tue)
2012-06-28-29 (Thu-Fri)
2012-07-04 (Wed)
2012-07-12-13 (Thu-Fri)
2012-07-22-23 (Sun-Mon)
2012-07-28 (Sat)
2012-08-02 (Thu)
 

www.time-price-research-astrofin.blogspot.com
Intermediate-Term Delta-Count (ITD):
2012-04-02 (Mon) = ITD #(9) = HIGH = MTD #10 = LTD #7 = SLTD #3 ?
2012-04-23 (Mon) = ITD #(11) = LOW = MTD #11 = LTD #8
2012-05-01 (Tue) = ITD #(11 x) = HIGH = MTD #12 ?
2012-05-04 (Fri) = ITD #(11 y) = LOW
2012-05-07 (Mon) = ITD #1 HIGH = MTD #12 ?
2012-05-18 (Fri) = ITD #(1) = LOW
2012-05-29 (Tue) = ITD #2 HIGH
2012-06-04 (Mon) = ITD #3 LOW = MTD #1 ? = LTD#8 ? = SLTD #4 ?
2012-06-11 (Mon) = ITD #4 HIGH [+/- 2 TD]
2012-06-18 (Mon) = ITD #5 LOW [+/- 2 TD] = MTD #1 ? = LTD#8 ? = SLTD #4 ?
2012-06-29 (Tue) = ITD #6 HIGH [+/- 2 TD] = MTD #2 ?
2012-07-09 (Mon) = ITD #7 LOW [+/- 2 TD]
2012-07-23 (Mon) = ITD #8 HIGH [+/- 2 TD] = MTD #2 ? = SLTD #3 ?
2012-08-01 (Wed) = ITD #9 LOW [+/- 2 TD]
2012-08-06 (Mon) = ITD #10 HIGH [+/- 2 TD] = MTD #2 ? = SLTD #3 ?

Astro-Events, Tides & Delta combined:
 
2012-06-10 (Sun) = AI 9
2012-06-10 06:55 (Sun) = MAR 0 SAT [helio]
2012-06-10 21:49 (Sun) = MER 180 NEP [helio]
2012-06-11 05:41 (Mon) = Third Lunar Quarter
2012-06-11 (Mon) = ITD #4 HIGH ?
2012-06-12 (Tue) = Bradley CIT [geo & helio]
2012-06-12 (Tue) = CIT of (Decl MER+MAR-VEN) = MWW-CIT
2012-06-13 (Wed) = Tidal CIT
2012-06-13 (Wed) = AI 0
2012-06-13 07:03 (Wed) = SUN 120 SAT = Level 2
2012-06-15 20:43 (Fri) = Moon @ Apogee
2012-06-16 (Sat) = Tidal CIT
2012-06-16 21:05 (Sat) = MER @ 178 [helio] = MWW-CIT
2012-06-17 00:00 (Sun) = SUN 180 Galactic Center
2012-06-18 18:20 (Mon) = MER 180 URA [helio]
2012-06-18 (Mon) = ITD #5 LOW [+/- 2 TD] = MTD #1 ? = LTD#8 ? = SLTD #4 ?
2012-06-19 10:02 (Tue) = New Moon
2012-06-20 18:08 (Wed) = Summer Solstice
2012-06-20 05:18 (Wed) = VEN 0 PLU [helio]


NOTE: Robert Hitt suggests the low of next week as early as late Wednesday "at a level that would generate fear but NOT a low below June 4th" [ www.astroecon.com ]. This would then become ITD #5 LOW and determine June 4th as ITD #3 LOW = MTD #1 + LTD#8 + SLTD # (see above chart). 


www.ChartLinesTrading.com


www.alphee.com 


See also HERE.


Thursday, June 7, 2012

Tuesday, June 5, 2012

Delta: Full Moon LOW - June 11 HIGH - June 18 LOW ?


The Inversion-Zone between ITD #11 and #2 ended with a ITD #2 High and the Full Moon #3 LOW on June 4. Now a rally into June 8-11 followed by another decline into June 18 is likely.