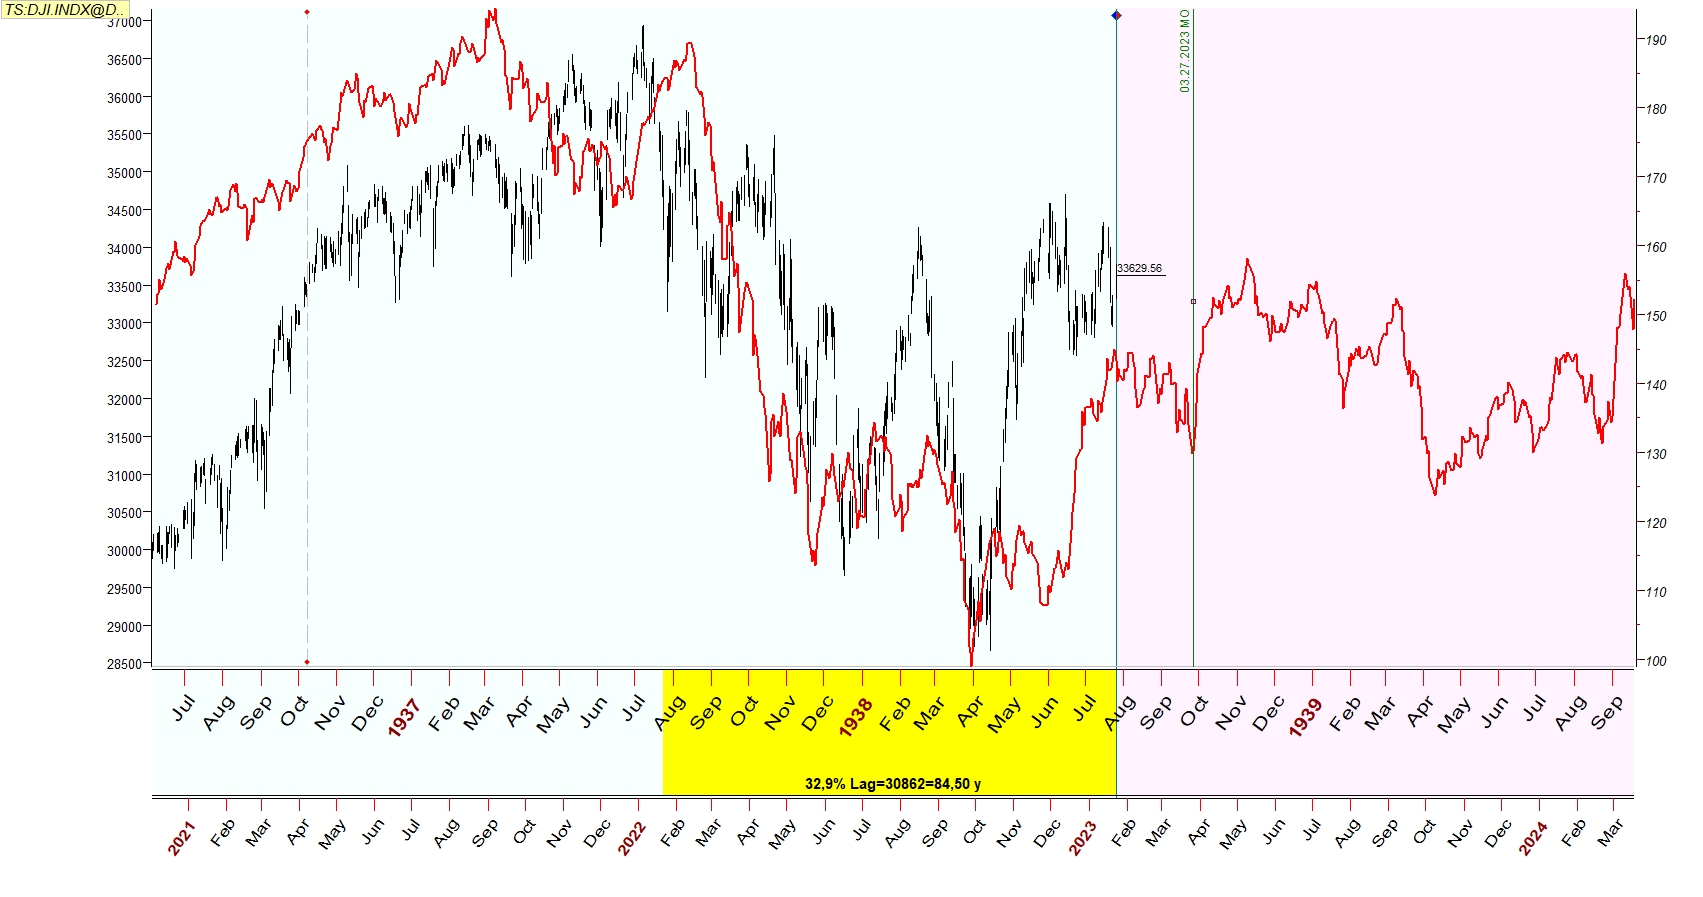
Thursday, January 12, 2023

The ICT Power of 3 | Accumulation - Manipulation - Distribution (AMD)

Accumulation - Manipulation - Distribution.

ICT Power of 3 Explained in 11 Minutes.

References:
 
See also:

Understanding the Real Economy | Martin A. Armstrong

Pieter Bruegel the Elder - Big Fish Eat Little Fish, 1556

Martin A. Armstrong (May 15, 2009) - The Economic Confidence Model that I discovered back in the 1970s was not based on any particular market or economy. It was devised by taking a list of world panics in the economy, irrespective of where they began, utilizing a list of 26 events between 1683 and 1907. It was dividing 26 into the 224 year time period that produced the basic frequency of 8.615384615. Like Adam Smith, I set out upon a course of observation to try to understand what made a cycle even exist. Through the course of my studies of the past and observations of the present, I came to realize that the observations uncovered a rich and dynamic structure of interactivity between mankind himself, as well as nature from weather to earthquakes. In short, what scientists were just then discovering with the aid of computers that could do millions of calculations impossible by hand, that the image of chaos has been completely altered. What may appear to be chaos, is in reality, only complex interaction that can be observed by only pealing back layers upon layers like an onion.
 
Written by Martin Armstrong on a type-writer while imprisioned in FCI, Fort Dix, New Jersey, 2009.

[...] Now that we understand what makes one economy boom against all others, or a particular sector within an economy because Capital Concentrates, now we can look at the ECM with the proper perspective. This is a global model of economic activity that highlights the raw fact that man will speculate no matter what and that creates the Capital Concentration. The ECM gives us the perspective of short-term business cycle movements at the 8.615384615 year level, but this frequency moved both up and down in time in layers like an onion. It builds into groups of 6 waves forming a 51.6 year major cyclical wave where confidence between the people and the state alternate at the generational level. This builds into 6 waves again of 51.6 years into 309.6 year waves upon which nations rise and fall.
 
 
[...] There are those who no matter what you show them or what you say they will never believe in cycles. For those of us who do, we need that disbelief to trade against. There always has to be two sides to a coin, as well as a market.


[...] Look a major collapses from all bubble tops and this is what you will find. The minimum amount of time to complete the fall and decline is this 31-34 month time period except in the Waterfall Events.

[...] There has been a lot written about the Science of Chaos. The true person to develop this field was B. Mandelbrot. The science of chaos that produced the fractal geometry I regard from a pure economic perspective as a proof of the existence of layers upon layers, but it offers no predictive value for our real economy in the traditional sense.

 
[...] What fractal geometry demonstrates is that there is no real just chaos, just such degree of complexity that our eye has been unable to see the complex order. Fractal Geometry and its insights is based upon Complex Numbers. For those who do not remember the school days, unlike all other numbers, the Complex Numbers do not exist on a horizontal plane. The Natural Numbers 1 through 9, for example, can be plotted on a horizontal line.
 

[...]
Unlike Natural Numbers, Complex Numbers do not exist on a horizontal line. They exist only on an x-y coordinate time plane where Natural Numbers and Regular Numbers on a horizontal grid combine into what we call Imaginary Numbers on the vertical grid. These Imaginary Numbers are simply numbers where taking a negative number times another negative number produces a negative instead of a positive number, i.e. -2 * -2 = -4.


[...]
We can see from the above illustration of the Economic Confidence Model that there has always been a delicate dance between the effects that follow the path of “time” as the Fourth Dimension adds to the basic equation What-How-Where with the fourth variable “When” and now we have the hidden complex field behind everything that adds the next portion to the equation “Why” that can be explained only by the Fifth Dimension of complex interaction through the process of “self-referral” that allows history to repeat. We are getting closer to the real causes and effects that have tormented mankind and often caused such hardship by the attribution of normal events to the folly of gods.


See also:

Monday, January 9, 2023

External & Internal Range Liquidity | Auction Process & Institutional Order Flow

External Range Liquidity is the liquidity that will be resting on previous highs and lows (these highs and lows are also used to define the range), this could be in the form of stops or pending orders. While Internal Range Liquidity is the liquidity inside the defined range (External Range Liquidity). This could be in form of any institutional reference that we can use as entry such as order blocks, fair value gaps, volume imbalance, and more.

HERE

The first thing to do to be able to identify external range liquidity and internal range liquidity is to define the range you will be working within, using swing highs and lows to mark the beginning and end of the range. Choose the recent trading range relative to your specific time frame when defining your range.

External Range Liquidity can act as a draw on liquidity based on order flow, meaning if we have external range liquidity on the previous low and the institutional order flow is bearish, price will be attracted or pulled towards our external range.
 
 
There are only three things price can do:
1. Breakout from a Range and Trend.
2. Breakout from a Range and Reverse (False Breakout or Stop Hunt).
3. Trading Range between Highs and Lows of sessions, days, weeks, months, quarters, years.
HERE
 
Crude Oil ranges to break:
Inside Session, Inside Day, Inside Week, Inside Month, Inside Quarter, Inside Year.
 
The Marker Makers Cyclic and Fractal Price Auction Process is mirrored in Price Action:
Expansion
is when Price moves quickly from a level of Equilibrium (50% of range).
Retracement is when Price moves back inside the recently created Price Range.
Market Makers look to reprice levels of imbalances that were not efficiently traded.
Reversal is when Price moves the opposite direction that current direction has taken it.
Market Makers have ran a level of Stops and a significant move should unfold in the new direction.
Liquidity Pools are just above an old Price High and just below an old Price Low.
Consolidation is when Price moves inside a clear trading range and shows no willingness to move
significantly higher or lower. Expect a new Expansion near term.
 
See also:

Wednesday, January 4, 2023

The Turn of the Year (TOY) Barometer | Wayne Whaley

Jason Leavitt (Jan 22, 2020) - According to Wayne Whaley, the most predictive period of the year is November 19 to January 19. He considers this period to be the single most reliable seasonality barometer of forward stock market returns – so much so that he’s said if he could only make one trade/year based on one indicator, this is the indicator he’d use. Whaley’s goal was to identify what he called the "kingpin of seasonal barometers." He stated: "I implored my computer to take a few seconds to exhaustively study S&P performance over every time period of the year and determine which time frame’s behavior was proprietor of the highest correlation coefficient relative to the following year’s performance."
 

What he found was there was a high correlation between the S&P 500’s returns between November 19th and the following January 19th and the S&P’s performance the 12 months following January 19. And since the 2-month period straddled the turn of the year and the gift giving season, he called it the TOY Barometer [...] if Nov 19 is on a weekend, use the Monday after the weekend, and if Jan 19 is on a weekend, use the Friday before). He only considered the price-only return (no dividends). If the return during this 2-month period was greater than 3%, a bullish signal was given, and the market was very likely to do well over the following 12 months. If the return was 0-3%, the signal was considered neutral, and results were somewhat random and in line with what is considered average. And if the return was negative, a bearish signal was given, and returns tended to be very poor.
 
Since 1950, there have been 36 bullish signals (including the one that just triggered), 19 neutral signals and 16 bearish signals [as of Jan 22, 2020]. Let’s look at each signal group.

Bullish Signals:    The 35 completed bullish signals have led to gains 33 times the following 12 months. The losses were in 1987, the year of one of the biggest single-day crashes in history, and 2018, that year that included a 20% drop during the fourth quarter. The average and median gains of the 12 months following the bullish signals were 17.7% and 15.1%. This isn’t much better than the “all years” stats, but the win rate (94%) is much higher than the “all years” win rate (73%). 
 

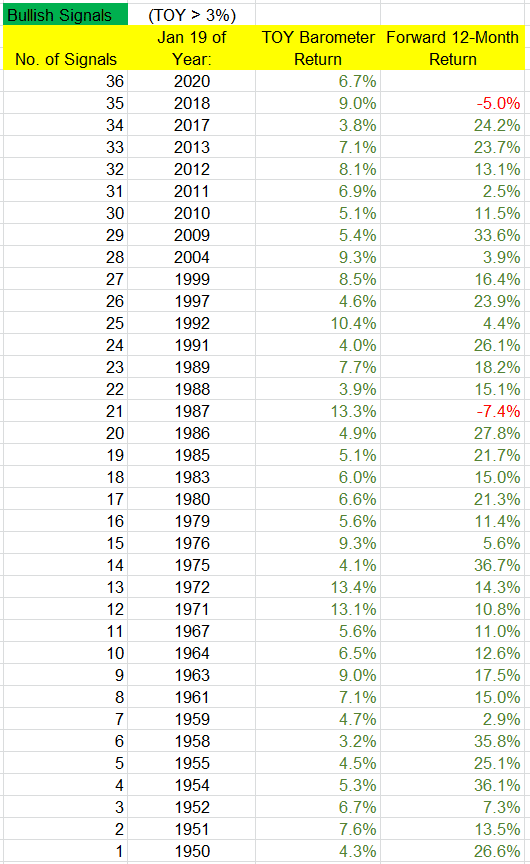
Neutral Signals:    There have been 19 neutral signals. The following year was positive 12 times (63%), compared to 73% win rate for “all years.” The overall average and median returns were 6.0% and 7.1%. But among the “up” years, the average and median gains were 14.4% and 9.4%, while the “down” years’ average and median losses were -8.5% and -7.8%. There were several big up years (1995, 1996, 1998, 2003), and two big down years (1973, 1977), so even if there is a neutral signal, there’s still a decent chance the following 12 months will venture far from its January 19 print.

Bearish Signals:    There have been 16 bearish signals. Only 6 (38%) of the following years posted a gain while 10 posted losses – and 6 of those 10 posted double digit losses. The overall average and median returns were -3.6% and -6.0%. The “up” years posted average and median gains of 14.6% and 15.5%, while the “down” years posted average and median losses of -14.6% and -12.9%. So despite the low win rate, when the market does well, it has the ability to do very well, as was the case this past year.

Summary:     
The bullish years have a very high win rate (94% vs 73% for “all years”). The average gain (17.7%) isn’t much higher than the “all years” gain (16.6%), so a bullish signal increases the odds of an up year but doesn’t increase the gain itself. 
 
The bearish years have a low win rate (38%). The gains during those up years (14.6% vs 16.6% for all years) are very good, but the losses during the down years are noticeably bigger than when a bullish or neutral signal is signaled (-14.6% vs -6.2% for bullish years and vs -8.5% for neutral years). So the odds of a down year are much higher, and the losses that follow are much bigger. 
 
The neutral years are mixed. The win rate is 63% (vs 72% for “all years”), with the gains during up years being pretty good (14.2% vs 16.6% for “all years”) and the losses during down years being moderate (a little worse than bullish years but much better than bearish years).

[...] When a bullish signal is in play, odds heavily favor solid gains over the following 12 months, but when there’s a bearish signal, odds favor a down year with a relatively big loss. But regardless of the signal, “up” years tend to be very good.


Quoted from:
 
See also
 

Monday, January 2, 2023

The Blue Church, the Blue Faith & Red Pills for 2023 | Jordan Hall

This is the formal core of the Blue Church: 
 
it solves the problem of 20th Century social complexity through the use of mass media to generate manageable social coherence.
 
The abstract is this: 
 
the Blue Church is a kind of narrative / ideology control structure that is a natural result of mass media. It is an evolved (rather than designed) function that has come over the past half-century to be deeply connected with the Democratic political “Establishment” and lightly connected with the “Deep State” to form an effective political and dominant cultural force in the United States.

We can trace its roots at least as far back as the beginning of the 20th Century where it emerged in response to the new capabilities of mass media for social control. By mid-century it began to play an increasingly meaningful role in forming and shaping American culture-producing institutions; became pervasive through the last half of the 20th and seems to have peaked in its influence somewhere in the first decade of the 21st Century.

It is now beginning to unravel.


In part it is unravelling because of developing schisms within its master narrative, the Blue Faith. These are important, but they are not the subject of this essay. In this essay, I am focusing on what I think is both much more fundamental and much less obvious: deep shifts in technology and society that are undermining the very foundations of the Church. Shifts that render the Church itself obsolete. 
If you are ready for a deep dive, come on in. The water is warm.